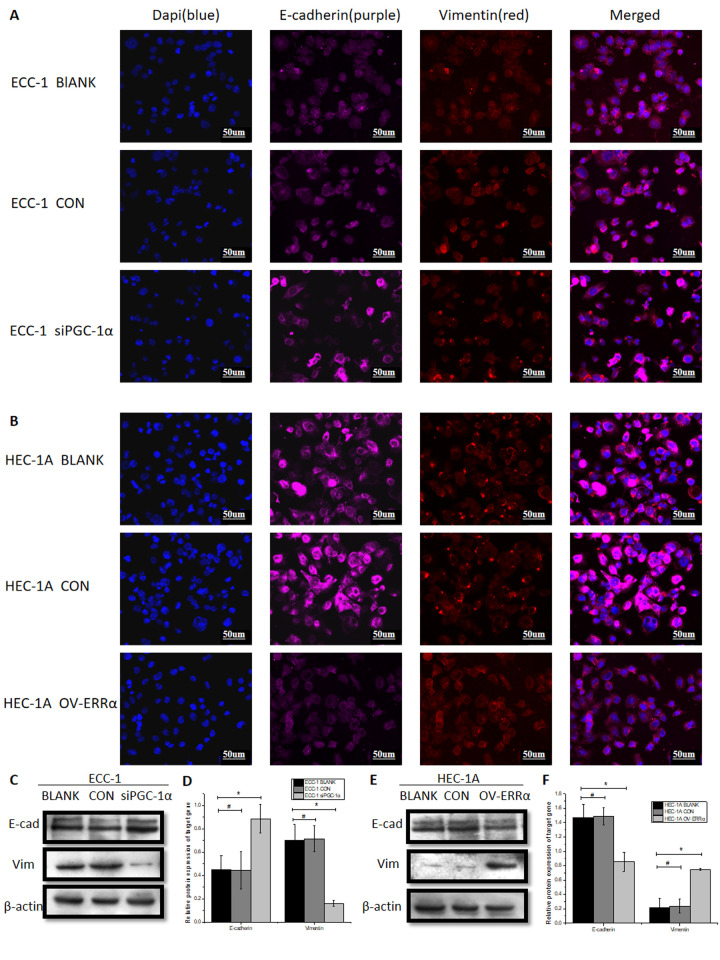
Figure 4.
Up-and down-regulation of PGC-1α and ERRα alter the EMT process in EC cells. (A) the representative immunofluorescence images of E-cadherin (purple) and vimentin (red) in ECC-1cells and siPGC-1α-ECC-1cells. The nucleus is blue. optical microscope and fluorescence microscopic with a magnification of 400. (B) the representative immunofluorescence images of E-cadherin (purple) and vimentin (red) in HEC-1A cells and OV-ERRα cells. (C) The protein of E-cadherin and vimentin were measured by Western blot analysis in ECC-1cells and siPGC-1α-ECC-1cells. (D) Quantification of E-cadherin and vimentin protein in ECC-1 cells. (E) The protein of E-cadherin and vimentin were measured by Western blot analysis in HEC-1A cells and OV-ERRα cells. (F) Quantification of of E-cadherin and vimentin protein in HEC-1A cells. *mean P<0.05, # mean P>0.05.

