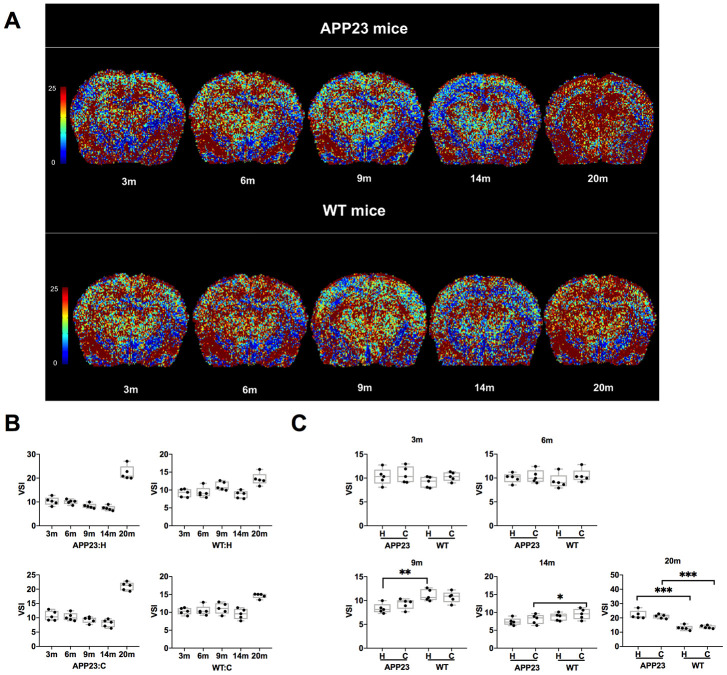
Figure 4.
VSI values in APP23 and WT mice of different ages. (A) Colormap of VSI in APP23 and WT mice of different ages. (B) VSI values of cortex and hippocampus in APP23 and WT mice at different ages. (C) Comparison of VSI values in cortex and hippocampus between APP23 and WT mice at the same age. WT: wide type; C: cortex; H: hippocampus; VSI, vessel size index.

