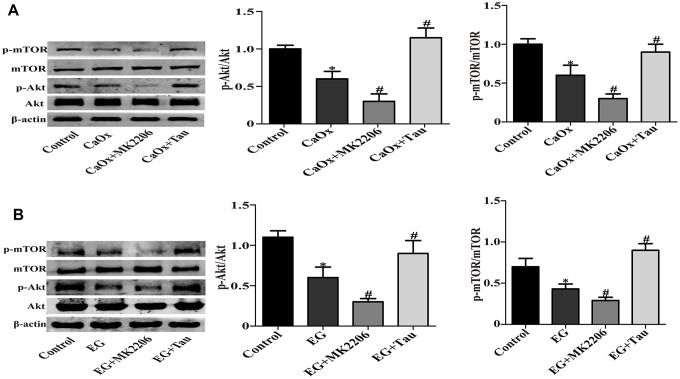
Figure 6.
Tau activates Akt/mTOR signaling pathway. (A) The expressions of mTOR, P-mTOR, Akt, and P-Akt in vitro. (B) Representative immunoblot and quantification analysis of mTOR, Akt, P-mTOR, and P-Akt in vivo. Data are presented as the mean ± SD (n=3). *P < 0.05 versus the control group, #P < 0.05 versus the CaOx group or the EG group.

