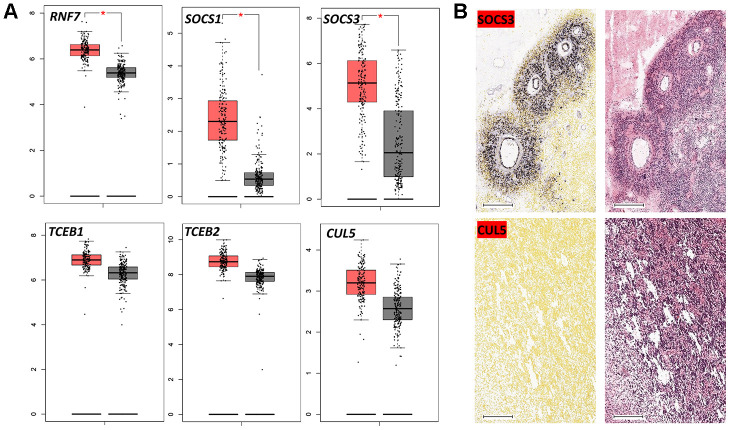
Figure 3.
Expression of CRL5 components in GBM. (A) Boxplot data analysis of genes encoding CRL5 components in GBM and normal brain tissues. GEPIA (http://gepia.cancer-pku.cn/) was used to analyze RNA-seq data from malignant and normal tissues (TCGA and GTEx datasets). (B) In situ hybridization of SOCS3 and CUL5 in GBM patients based on the Ivy GAP dataset. * P < 0.01.

