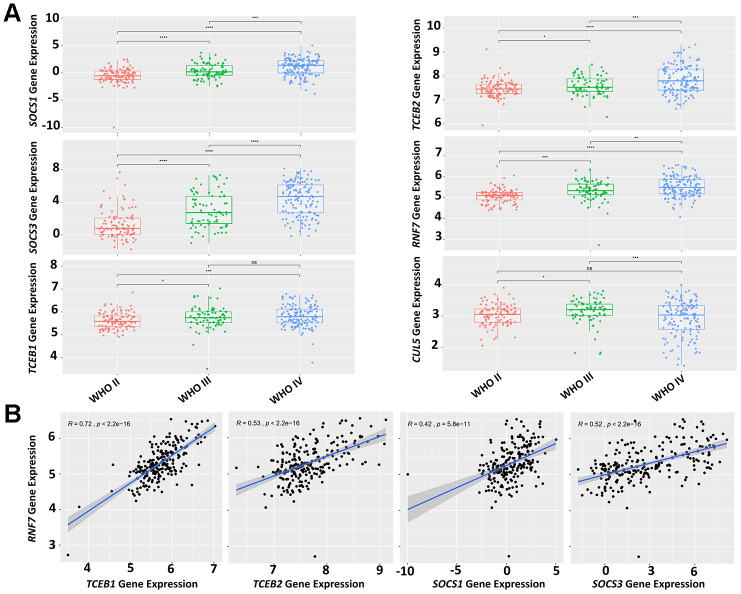
Figure 4.
Expression levels of CRL5 components correlate with glioma grading. (A) A CGGA dataset (mRNAseq_325) was used for analysis of CRL5 component gene expression and glioma grading. (B) A CGGA dataset (mRNAseq_325) was used for correlation analysis of gene expression between RNF7 and TCEB1, TCEB2, SOCS1 and SOCS3 with R values of 0.72, 0.53, 0.42, 0.52, respectively. The P values in each pair were all less than 1e-10.

