Figure 5.
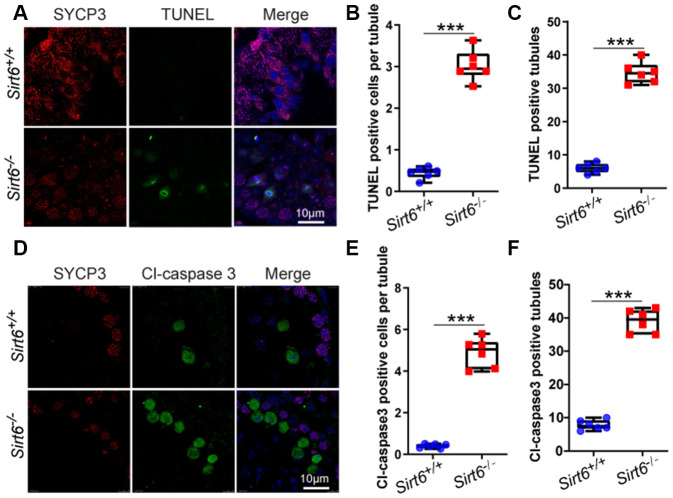
Sirt6 deficiency results in increased apoptotic spermatids. (A) Paraffin embedded sections from Sirt6+/+ and Sirt6-/- testes were stained with TUNEL kit (green) and SYCP3 (red) to determine the presence of apoptotic cells. 8-week mice, n=6. (B) Quantification of TUNEL positive cells per tubule of the Sirt6+/+ and Sirt6-/- mice. Sirt6+/+, 0.45±0.1; Sirt6-/-, 3.03±0.25. 8-week mice, n=6; 533 cells were used for each group. Data are presented as mean ± SEM. ***P < 0.001. (C) Quantification of TUNEL positive tubules of the Sirt6+/+ and Sirt6-/- mice. Sirt6+/+, 6.00±0.49; Sirt6-/-, 34.67±0.53. 8-week mice, n=6; 228 seminiferous tubules were used for each group. Data are presented as mean ± SEM. ***P < 0.001. (D) Paraffin embedded sections from Sirt6+/+ and Sirt6-/- testes were stained with Cl-caspase3 (green), SYCP3 (red) and DAPI (blue) to determine the presence of apoptotic cells. 8-week mice, n=6. (E) Quantification of Cl-caspase3 positive cells per tubule of the Sirt6+/+ and Sirt6-/- mice. Sirt6+/+, 0.40±0.13; Sirt6-/-, 4.88±0.34. 8-week mice, n=6; 497cells were used for each group. Data are presented as mean ± SEM. ***P < 0.001. (F) Quantification of Cl-caspase3 positive tubules of the Sirt6+/+ and Sirt6-/- mice. Sirt6+/+, 7.83±0.50; Sirt6-/-, 39.00±0.59. 8-week mice, n=6; 201 seminiferous tubules were used for each group. Data are presented as mean ± SEM. ***P < 0.001.

