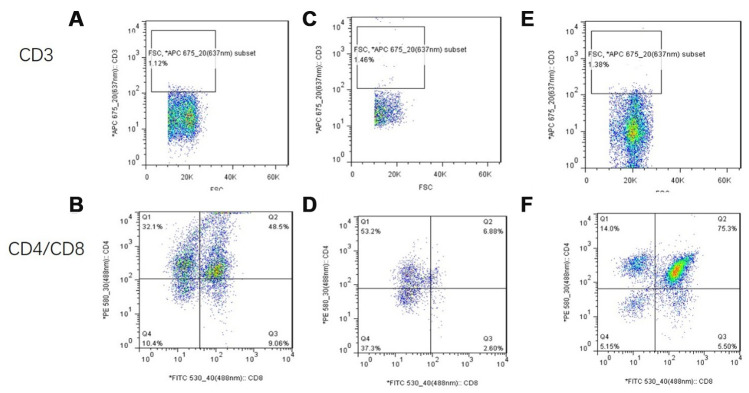
Figure 22.
Flow cytometry analysis of single-cell suspensions of thymus tissue after mUCMSC treatment. Note: (A, B) show flow cytometry of thymocytes in the treatment group after 1 month of treatment. (C, D) show flow cytometry of a single-cell suspension of mouse thymus tissue from the model control group. (E, F) show flow cytometry detection of a single-cell suspension of thymus tissue from the young control group. CD3 was not expressed in any of the three groups. The proportion of CD8+ cells in the treatment group was significantly higher than that in the model control group.

