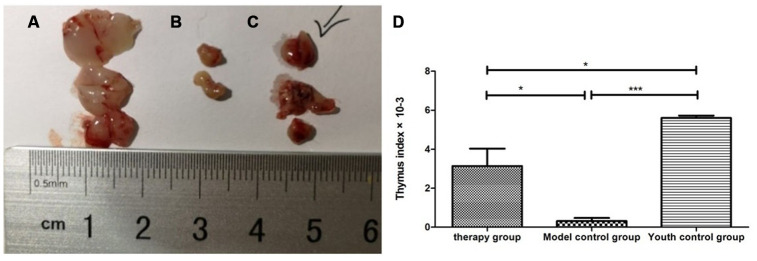
Figure 8.
Changes in the thymus index in mice after mUCMSC treatment. (A) Young control group; (B) model control group; (C) treatment group; (D) thymus index after mUCMSC treatment. According to statistical analysis, the mean values of the thymus index in the young group, the treatment group, and the model control group were 5.60 ± 0.21, 3.10 ± 1.54, and 0.47 ± 0.21, respectively.

