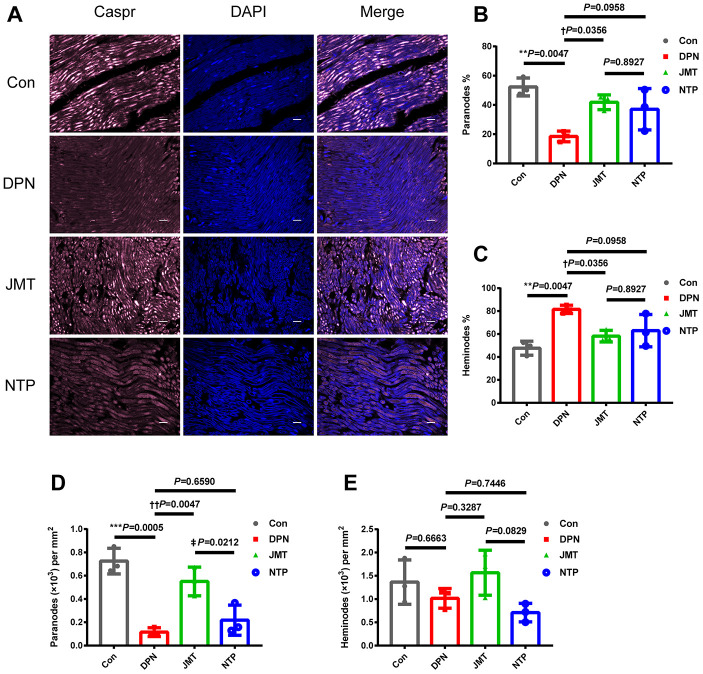
Figure 3.
JMT protected paranodal structures in the sciatic nerves of DPN rats. (A) Representative images of longitudinal sections of sciatic nerves with immunolabeling for Caspr (pink) and counterstained with DAPI (blue, marking nuclei) at a magnification of 400×; scale bars, 20 μm. Percentage of (B) paranodes and (C) heminodes at paranodal junctions in the sciatic nerves of rats. Number of (D) paranodes and (E) heminodes per mm2 in the sciatic nerves of rats. Means ± SD; n=3/group. ***p < 0.001, **p < 0.01 vs. normal control group; ††P < 0.01, †P < 0.05 vs. distilled water-treated DPN group. ‡p < 0.05 vs. JMT-treated DPN group. One-way ANOVA followed by Tukey’s multiple comparison test.

