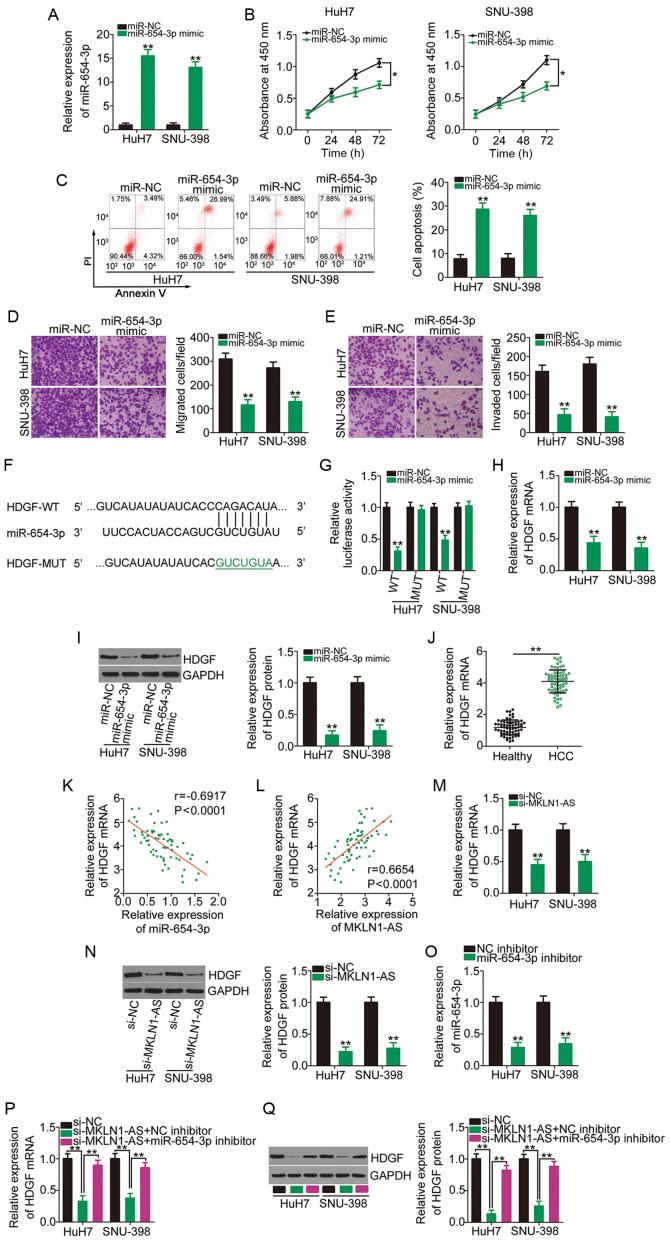
Figure 4.
MKLN1-AS positively regulates HDGF expression in HCC cells via competitive sponging of miR-654-3p. (A) HuH7 and SNU-398 cells were transfected with miR-654-3p mimic or miR-NC and subjected to RT-qPCR to determine transfection efficiency. **P<0.01 compared with miR-NC. (B) Proliferation and (C) apoptosis of miR-654-3p-overexpressing HuH7 and SNU-398 cells were evaluated using the Cell Counting Kit-8 assay and flow cytometry analysis, respectively. *P<0.05 compared with miR-NC. **P<0.01 compared with miR-NC. (D) Migration and (E) invasion assays were used to examine the migratory and invasive capacities of HuH7 and SNU-398 cells after overexpression of miR-654-3p. **P<0.01 compared with miR-NC. (F) Schematic representation of the WT and MUT complementary base pairs between miR-654-3p and the 3′-untranslated region of HDGF. (G) Luciferase activity of HDGF-WT or HDGF-MUT was determined in HuH7 and SNU-398 cells transfected with miR-654-3p mimics or miR-NC. **P<0.01 compared with miR-NC. (H) HDGF mRNA and (I) protein expression levels were quantified in HuH7 and SNU-398 cells transfected with miR-654-3p mimics or miR-NC. **P<0.01 compared with miR-NC. (J) RT-qPCR was performed to analyze HDGF mRNA expression in 65 pairs of HCC tissues and corresponding adjacent healthy tissues. **P<0.01 compared with adjacent healthy tissues. (K) Correlation between miR-654-3p and HDGF mRNA expression levels in the 65 HCC tissues was examined via Pearson's correlation coefficient. (L) Pearson's correlation coefficient analysis of MKLN1-AS and HDGF mRNA expression levels in the 65 HCC tissues. Changes in HDGF (M) mRNA and (N) protein expression levels in MKLN1-AS-depleted HuH7 and SNU-398 cells were determined using RT-qPCR and western blotting, respectively. **P<0.01 compared with si-NC. (O) Silencing efficiency of miR-654-3p inhibitor in HuH7 and SNU-398 cells was assessed using RT-qPCR. **P<0.01 compared with NC inhibitor. miR-654-3p inhibitor or NC inhibitor was transfected into HuH7 and SNU-398 cells in the presence of si-MKLN1-AS. After transfection, the (P) mRNA and (Q) protein expression levels of HDGF were measured using RT-qPCR and western blotting. **P<0.01 compared with group si-MKLN1-AS + miR-654-3p inhibitor and group si-NC. MKLN1-AS, muskelin 1 antisense RNA; NC, negative control; si, small interfering RNA; WT, wild-type; MUT, mutation; miR, microRNA; RT-qPCR, reverse transcription-quantitative PCR; HDGF, hepatoma-derived growth factor.

