
Figure 1.
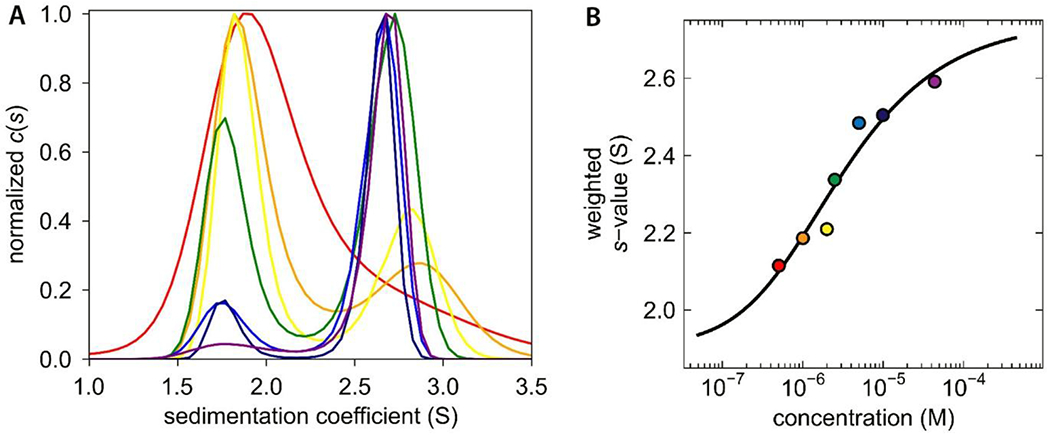
Sedimentation velocity analysis of Dictyostelium Skp1. (A) c(s) distribution reveals concentration dependence of dimerization. The concentration range is depicted by a rainbow spectrum with the lowest concentration in red and the highest in purple. (B) An isotherm was constructed with weighted s-values (Sw); the fitted model indicates a Kd of 2.5 µM. The color of each data point corresponds to the respective c(s) distribution in panel A.