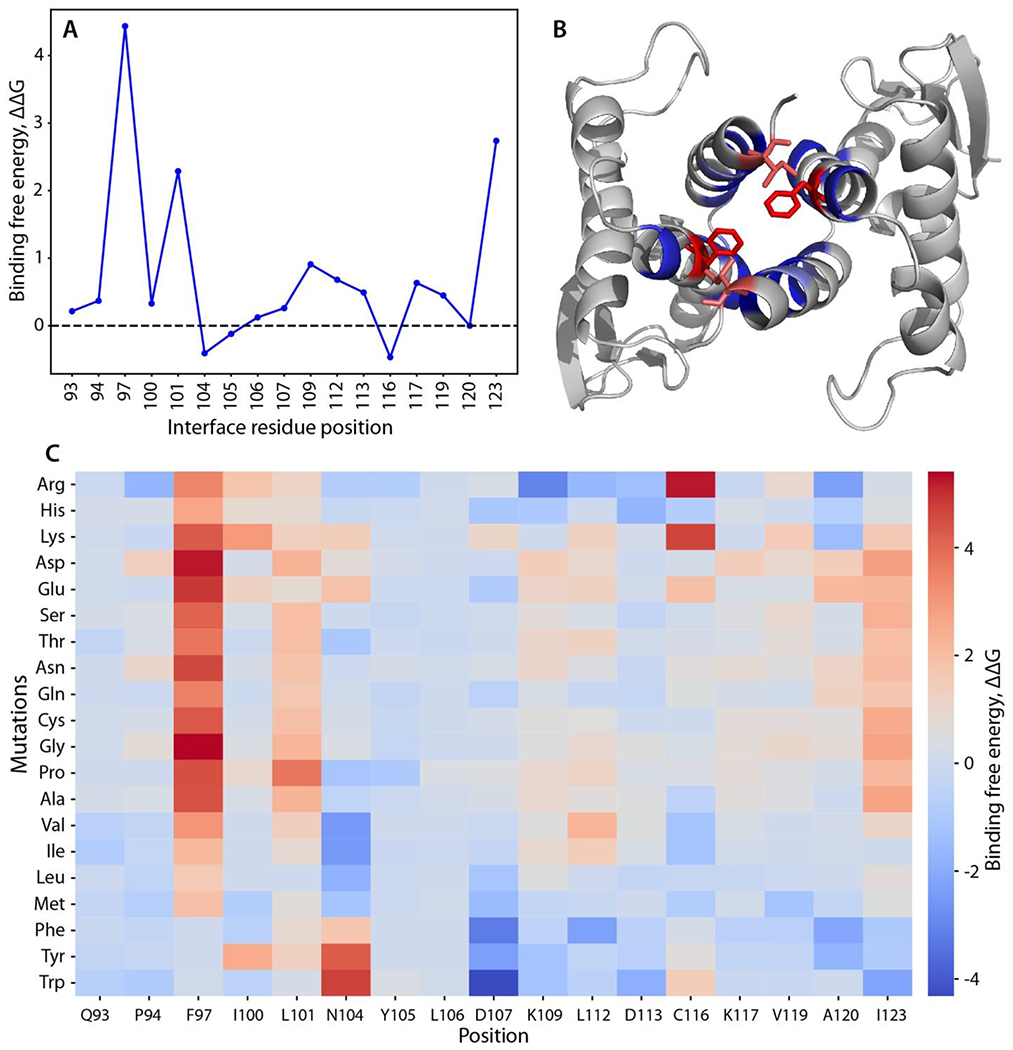
Figure 3.

Computational scanning mutagenesis of the Skp1ΔΔ homodimer interface. (A) Alanine-scanning mutagenesis using Rosetta. Changes in binding free energy upon replacement with alanine are shown according to the interface residue positions. (B) Skp1 dimer protein-protein interface. Residues with the highest binding free energy change (Phe97 and Ile123) are emphasized in stick representation and in red; other mutated residues are in blue. See panel C for color code explanation. (C) Heatmap of the changes in binding free energy upon all amino acid substitutions. Effects of amino acid replacements are shown for each interface position. The colors represent the changes in the binding free energy of the dimer (interface ΔΔG score). Values greater than one (warmer colors) indicate destabilizing mutations, and values less than one (colder colors) imply stabilizing mutation.28 Compare with effects on the monomer state (Fig. S8).
