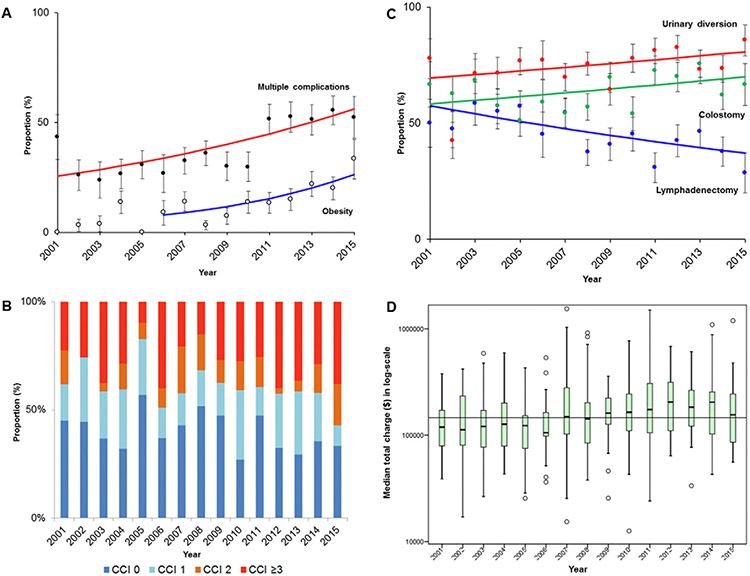
Fig. 1.
Trends of comorbidity and outcome of pelvic exenteration between 2001 and 2015. Year-specific trends of A) obesity and multiple complications during the index admission, B) Charlson Comorbidity Index (P < 0.001), C) surgical performance, and D) median total charge of the index admission converted to 2015 value are shown (median total charge of $146,366 for horizontal line; P < 0.001). For panel A and C, dots represent actual observed value, bars represent confidence interval, and lines represent modeled value. For panel D, box plots are shown with log-transformed values. Abbreviation: CCI, Charlson Comorbidity Index.

