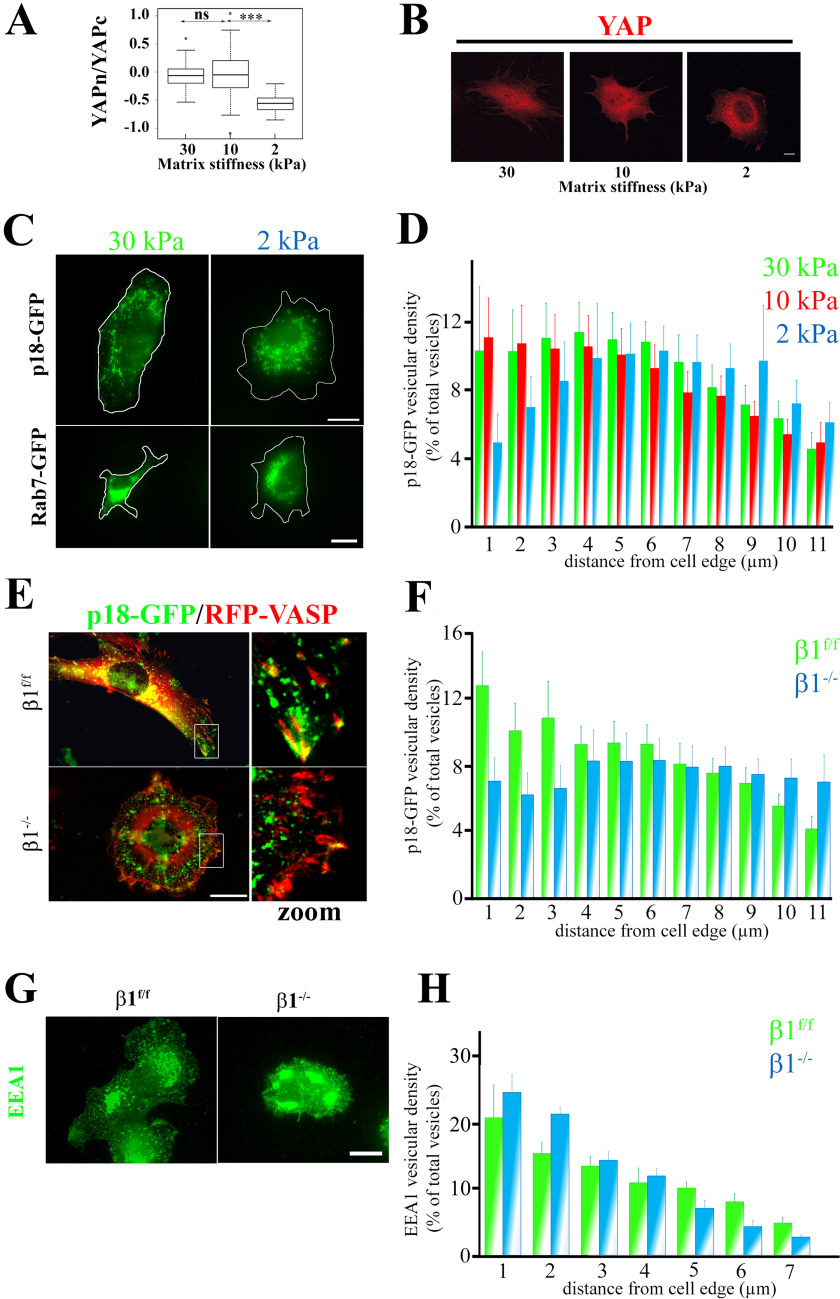
Figure 1.
Mechanical and β1 integrin–mediated regulation of YAP and LE subcellular localization in preosteoblasts. A, comparison of YAP cytoplasmic/nuclear ratios in different stiffness conditions. Preosteoblast cells that stably express mCherry-YAPwt were seeded and grown on fibronectin-coated PDMS hydrogels of different stiffness (30, 10, and 2 kPa) for 2 h. YAP subcellular localization was then analyzed by fluorescence imaging with a confocal microscope. Intensity values were obtained using Fiji software (data are represented on a logarithmic scale). Data were compared with the two-tailed unpaired Student's t test and are representative of two independent experiments with n > 30 cells analyzed (***, p < 0.0001; ns, not significant). B, subcellular localization of mCherry-YAPwt (red) in preosteoblast cells spread on fibronectin-coated PDMS hydrogels of different stiffness (Young moduli are 30, 10, and 2 kPa) for 2 h. Scale bar, 10 μm. C, subcellular localization of p18/LAMTOR1 (top panels) and Rab-7 (bottom panels) in preosteoblast cells spread on fibronectin-coated PDMS hydrogels of different stiffness (Young moduli are 30, 10, and 2 kPa) for 2 h. Scale bar, 10 μm. D, comparison of p18/LAMTOR1-GFP subcellular distribution in preosteoblast cells spread on fibronectin-coated PDMS hydrogels of different stiffness (30, 10, and 2 kPa) for 2 h. GFP fluorescence was imaged, and p18/LAMTOR1 distribution was analyzed using Icy software. The histogram shows the localization of p18/LAMTOR1-positive vesicles from the cell edges to the nucleus (expressed as percentage of all vesicles). Data are the mean ± S.D. (error bars) of two independent experiments. The localization of p18/LAMTOR1-positive vesicles was significantly (E) different only between the 20- and 2-kPa conditions for 0–1 (***) and 1–2 (**) µm (two-tailed unpaired Student's t test). F, control (β1f/f) and β1 integrin–deficient preosteoblasts (β1−/−) that stably express p18/LAMTOR1-GFP (green) and mRFP-VASP (red) were grown overnight on glass coverslips and then imaged by fluorescence microscopy. Scale bar, 10 μm. G, comparison of p18/LAMTOR1-GFP subcellular distribution in control (β1f/f, green) and in β1-deficient osteoblasts (β1−/−, blue) cells quantified using Icy software. Histograms represent the localization from the cell edges to the cell nucleus, which is expressed as a percentage of all vesicles. The localization of p18/LAMTOR1-positive vesicles was significantly different only for 0–1 (***) and 1–2 (**) µm (two-tailed unpaired Student's t test). H, control (β1f/f) and β1 integrin–deficient preosteoblasts (β1−/−) were grown overnight on glass coverslips and stained for EEA1 to visualized early endosomes. Scale bar, 10 μm. I, comparison of the subcellular distribution of EEA1-positive vesicles in control (β1f/f, green) and in β1-deficient osteoblasts (β1−/−, blue) cells quantified using Icy software. Histograms represent the localization from the cell edges to the cell nucleus, which is expressed as a percentage of all vesicles.

