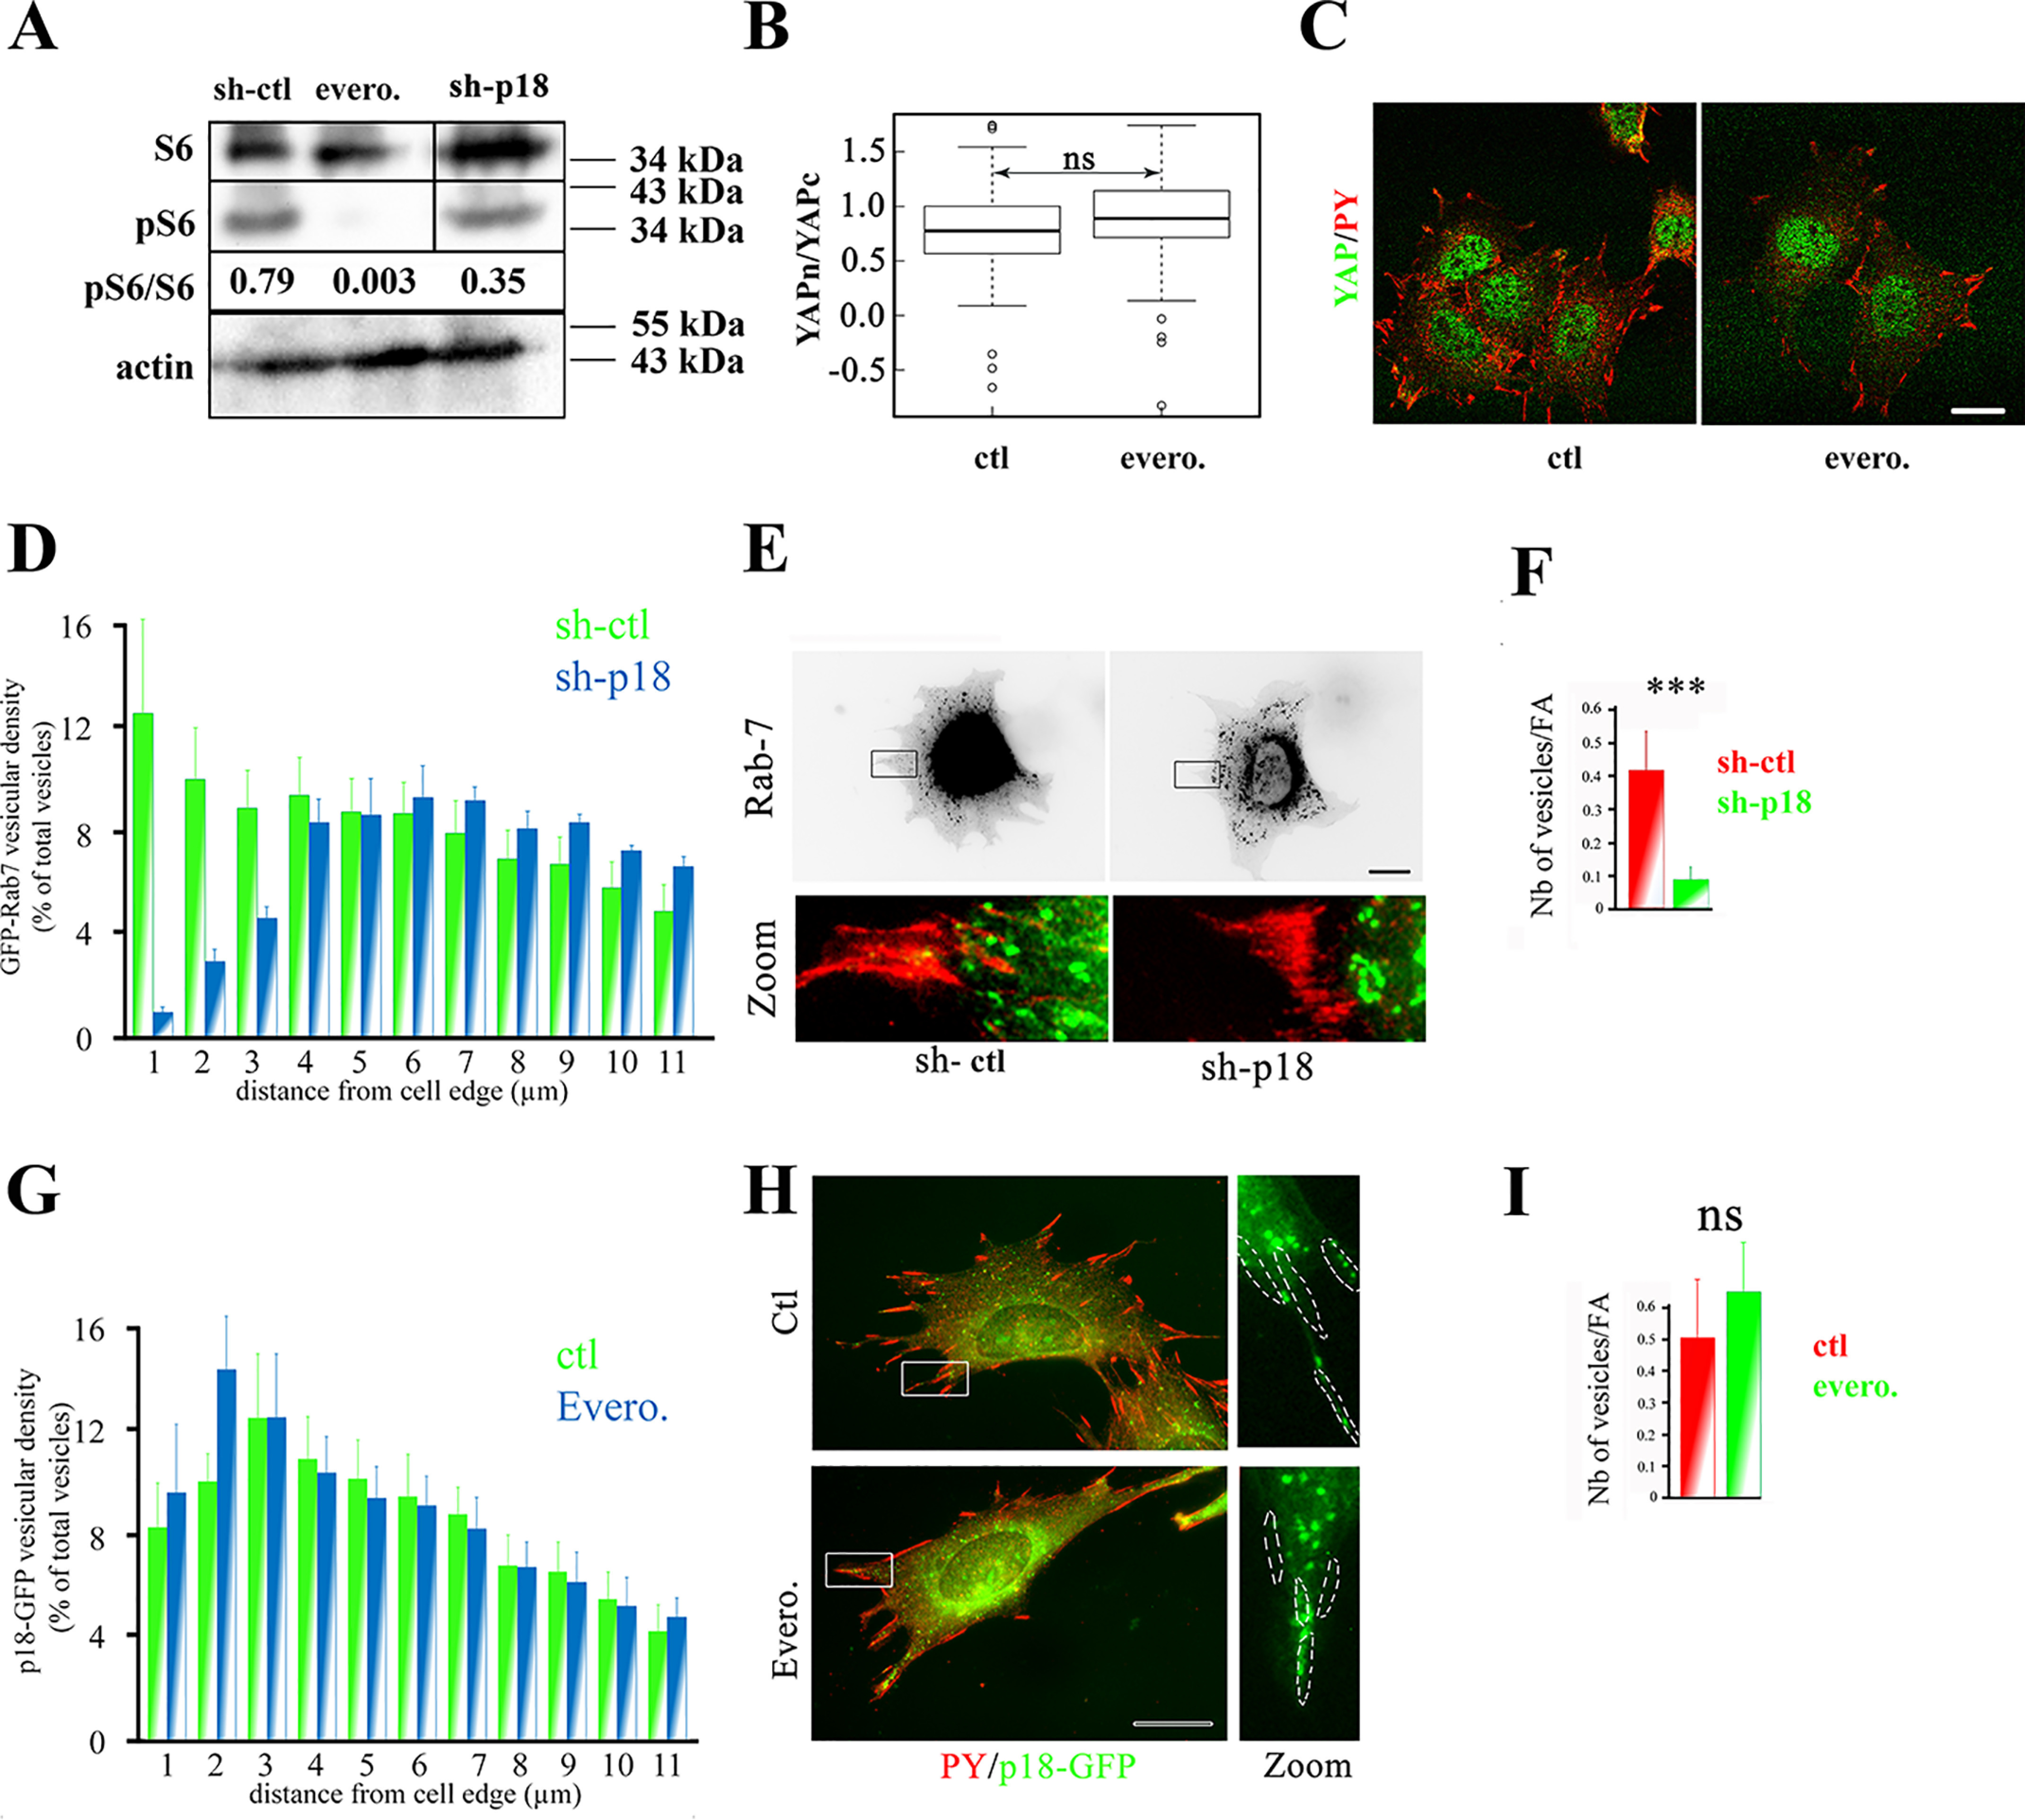
Figure 3.

p18/LAMTOR1 controls LE peripheral distribution and YAP signaling in a mTORC1-independent manner. A, Western blotting analysis of the ribosomal protein S6 (S6) and its phosphorylated form (pS6). Preosteoblasts (β1f/f) were incubated (evero.) or not (ctl) with everolimus (10 nm, 3 h). Band intensity was quantified with a Chemidoc CCD camera (Bio-Rad) and Image Laboratory software (Bio-Rad). Actin was used as internal loading control. Results are representative of three independent experiments. B, comparison of YAP cytoplasmic to nuclear ratio (logarithmic scale) in preosteoblasts (β1f/f) grown overnight and then incubated (evero.) or not (ctl) with everolimus (10 nm, 3 h) and stained for YAP. YAP subcellular localization was analyzed by confocal microscopy, and intensity values were obtained using Fiji software. Data are the mean ± S.D. (error bars) of two independent experiments with n >30 cells analyzed (two-tailed unpaired Student's t test). C, immunostaining of YAP (green) in preosteoblasts (β1f/f) incubated (evero.) or not (ctl) with everolimus (10 nm, 3 h). Cells were incubated with antibodies against YAP and phosphorylated tyrosines (PY) to label focal adhesions. Images were obtained with a confocal microscope. Bar, 10 μm. D, comparison of Rab-7–GFP subcellular distribution in sh-ctl (green histograms) and sh-p18 (blue histograms) cells. Rab-7–GFP distribution was analyzed using Icy software. Data are the mean ± S.D. (two experiments) of Rab-7–positive vesicle localization from the cell edges to the cell nucleus (percentage of all vesicles). Vesicular distribution was significantly different for : 0–3 μm (p < 0.0001), 10–12 μm (p < 0.001) and 8–10 μm (p < 0.01). Due to the lack of an appropriate tagged p18/LAMTOR1 construct, rescued cells were not investigated in this experiment. E, sh-ctl and sh-p18 cells that stably express mRFP-paxillin (red) were transiently transfected with GFP–Rab-7 (green). 24 h post-transfection, cells were seeded on glass coverslips and fixed overnight. Due to the lack of an appropriate tagged p18/LAMTOR1 construct, rescued cells were not investigated. Scale bar, 10 μm. F, quantification of GFP–Rab-7 targeting to focal adhesions in control (sh-ctl, red) and sh-p18 cells (green). Two-tailed unpaired Student's t test was used with n = 20 cells/condition. *** p < 0.0001. G, comparison of p18-GFP subcellular distribution in control (ctl, red) and everolimus-treated cells (evero., green). p18-GFP distribution was analyzed using Icy software. A histogram represents the stepwise localization of p18-GFP–positive vesicles (percentage of all vesicles) from the cell edges to the cell nucleus, and data are the mean ± S.D. of three independent experiments (n >30 cells/condition; two-tailed unpaired Student's t test). H, preosteoblast cells were incubated (evero) or not (ctl) with everolimus (10 nm, 3 h), and p18-GFP distribution was visualized. Cells were labeled with the anti-phosphotyrosine (PY) antibody to FAs. Bar, 10 μm. I, quantification of p18-GFP targeting to FAs in control (red) and everolimus (10 nm, 3 h)-treated cells. Data were compared with the two-tailed unpaired Student's t test (n = 15 cells/condition). ns, not significant.
