Figure 1.

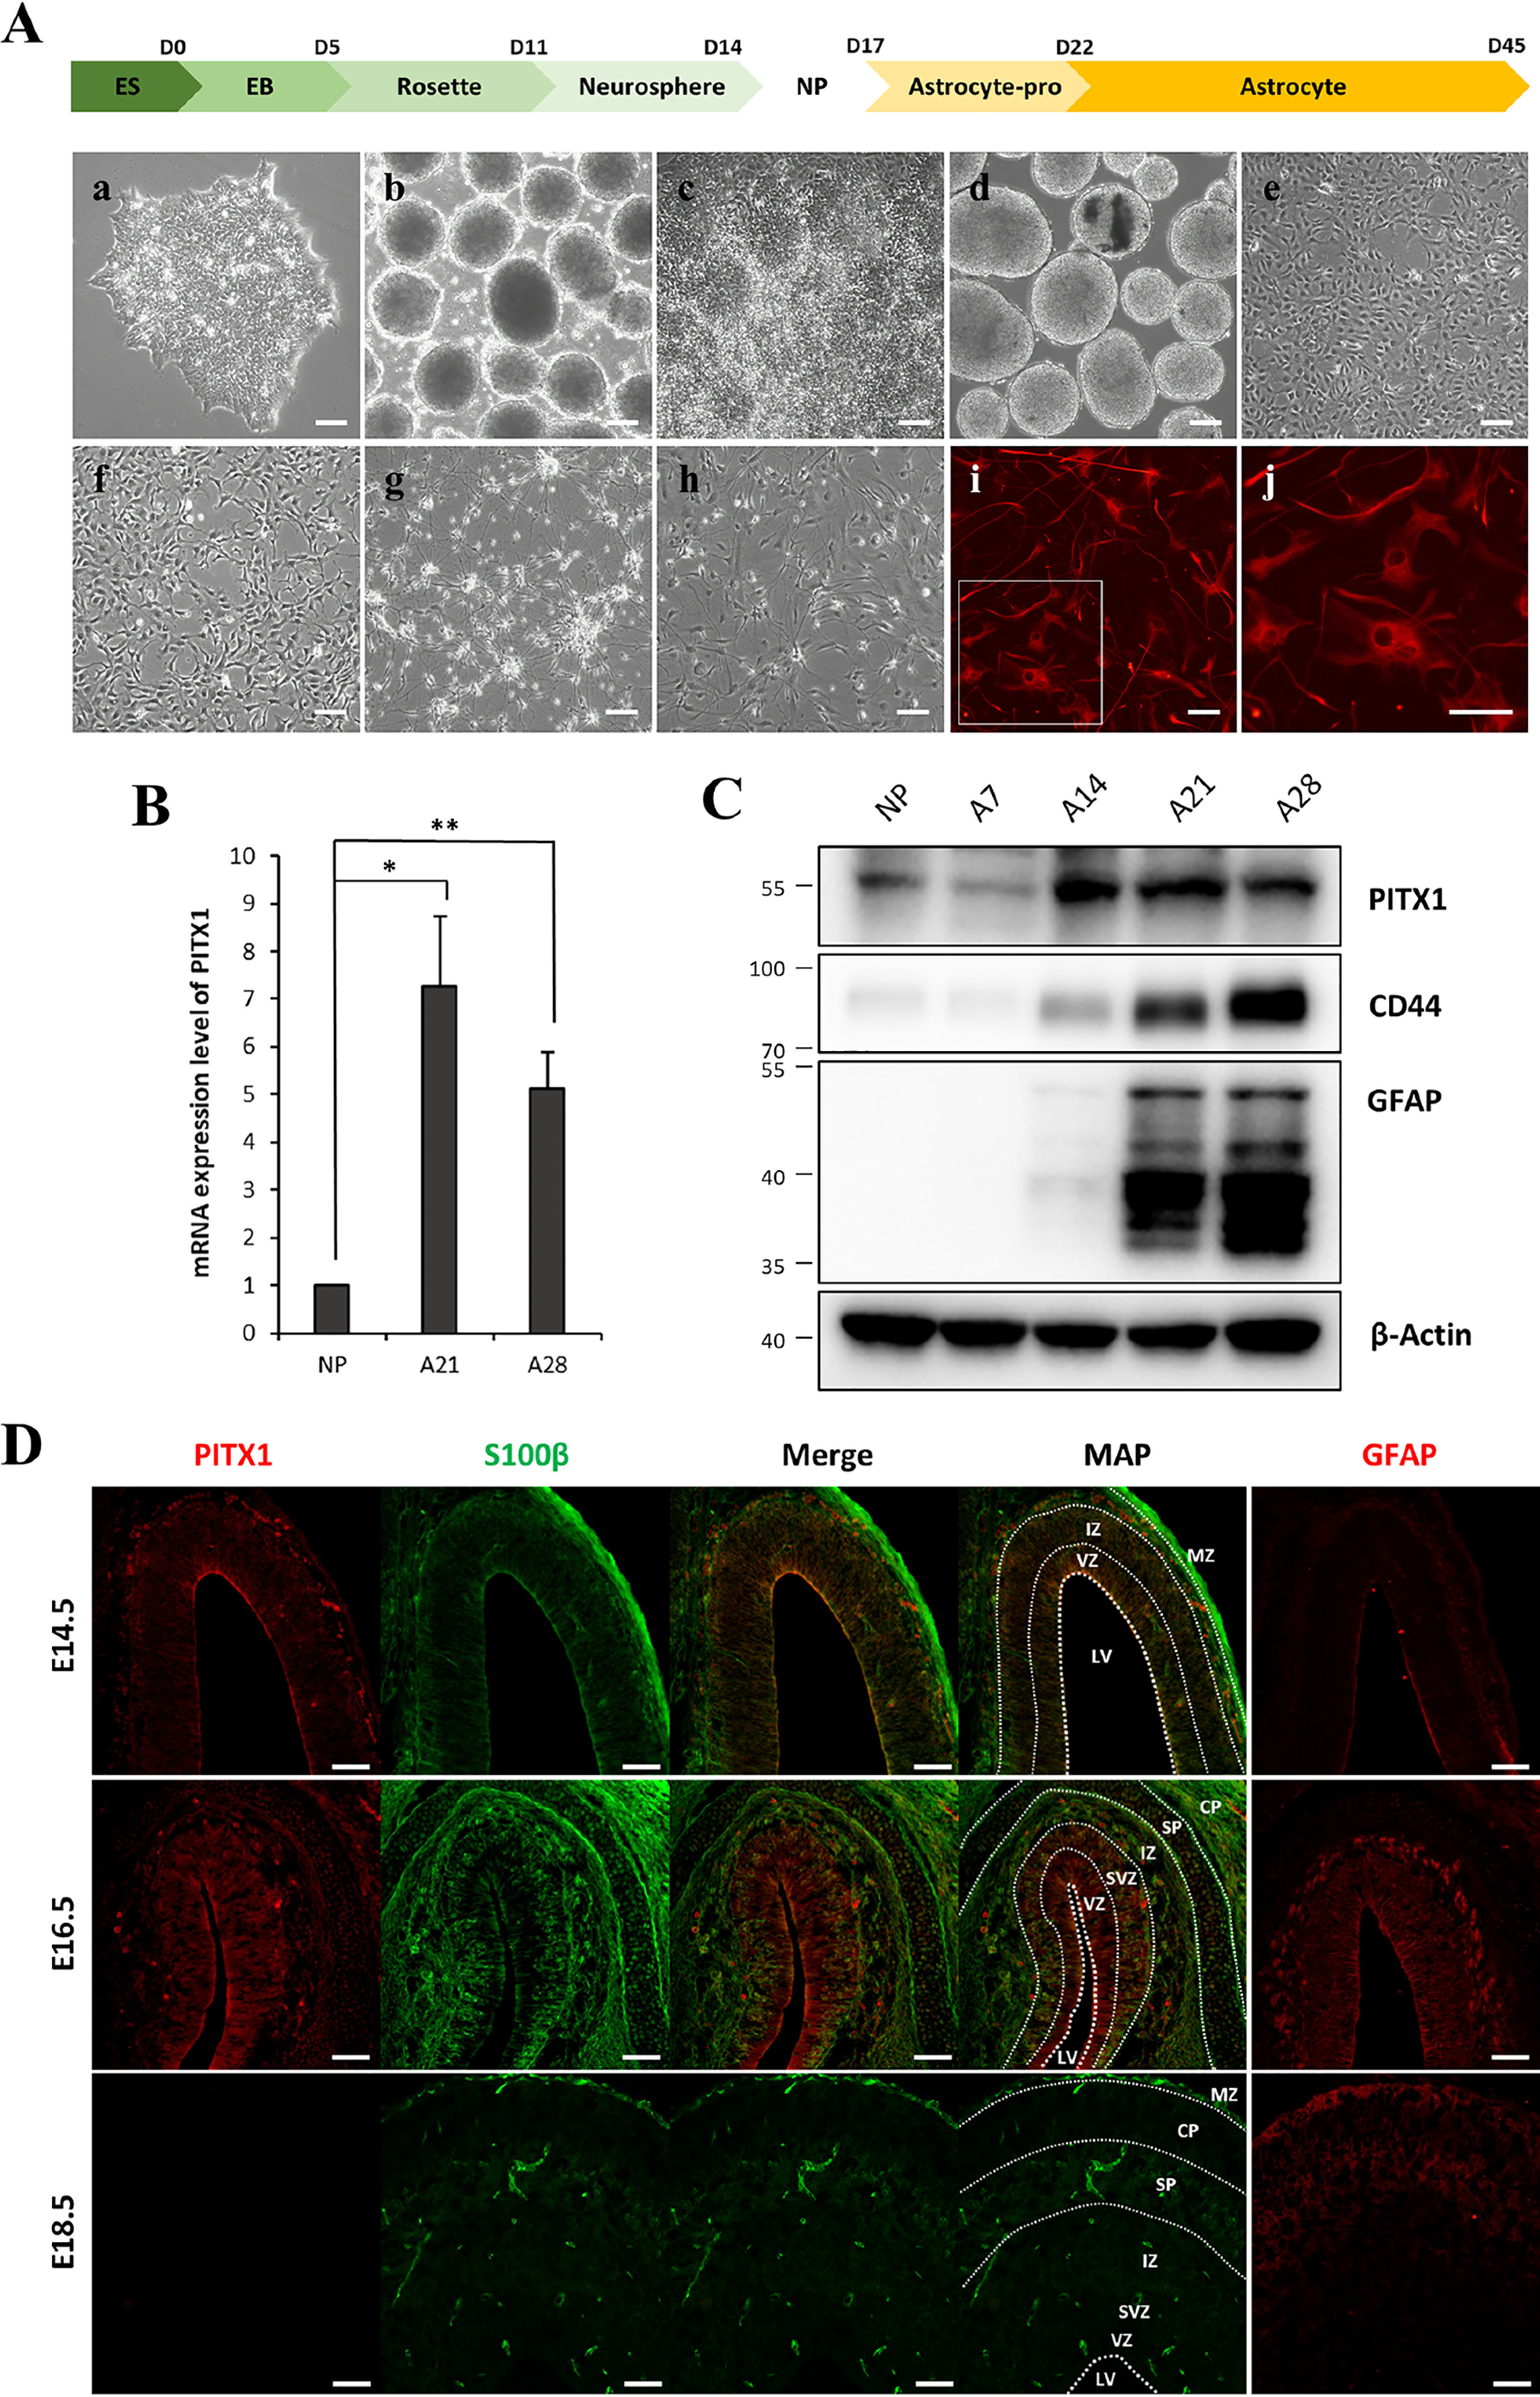
Expression of PITX1 increased during astrocyte differentiation. A, schematic showing the process of astrocyte differentiation from hESCs. Panels show light microscopic images of from hESCs (panel a), EBs (panel b), rosettes (panel c), neurospheres (panel d), NPCs (panel e), astrocyte progenitors on day 5 (panel f), astrocytes on day 14 (panel g), and astrocytes on day 28 of differentiation (panel h), as well as immunofluorescence images of the mature astrocyte marker GFAP (red) on day 28 at low magnification (panel i) and high magnification (panel j). B, relative PITX1 mRNA expression on different days of astrocyte differentiation according to real-time PCR. mRNA expression levels were normalized to β-actin expression level. The bars represent the fold change relative to (undifferentiated) NPCs. C, Western blotting showing the protein levels of PITX1, CD44, GFAP, and β-actin on different days of astrocyte differentiation. The data are expressed as the means ± S.E. of three independent experiments. Statistical significance was determined by independent sample t test. *, p < 0.05; **, p < 0.01. D, immunoexpression pattern of differentiating astrocytes in vivo. Rat embryonic brains (E14.5, E16.5, and E18.5) were immunostained for PITX1 (red), S100β (green), and GFAP (red). Map panels show the structure of brain layers, and dashed lines indicate layer boundaries. PITX1 and S100β were co-stained, and GFAP was stained separately in other sections. Scale bars, 100 μm in A and 75 μm in D.
