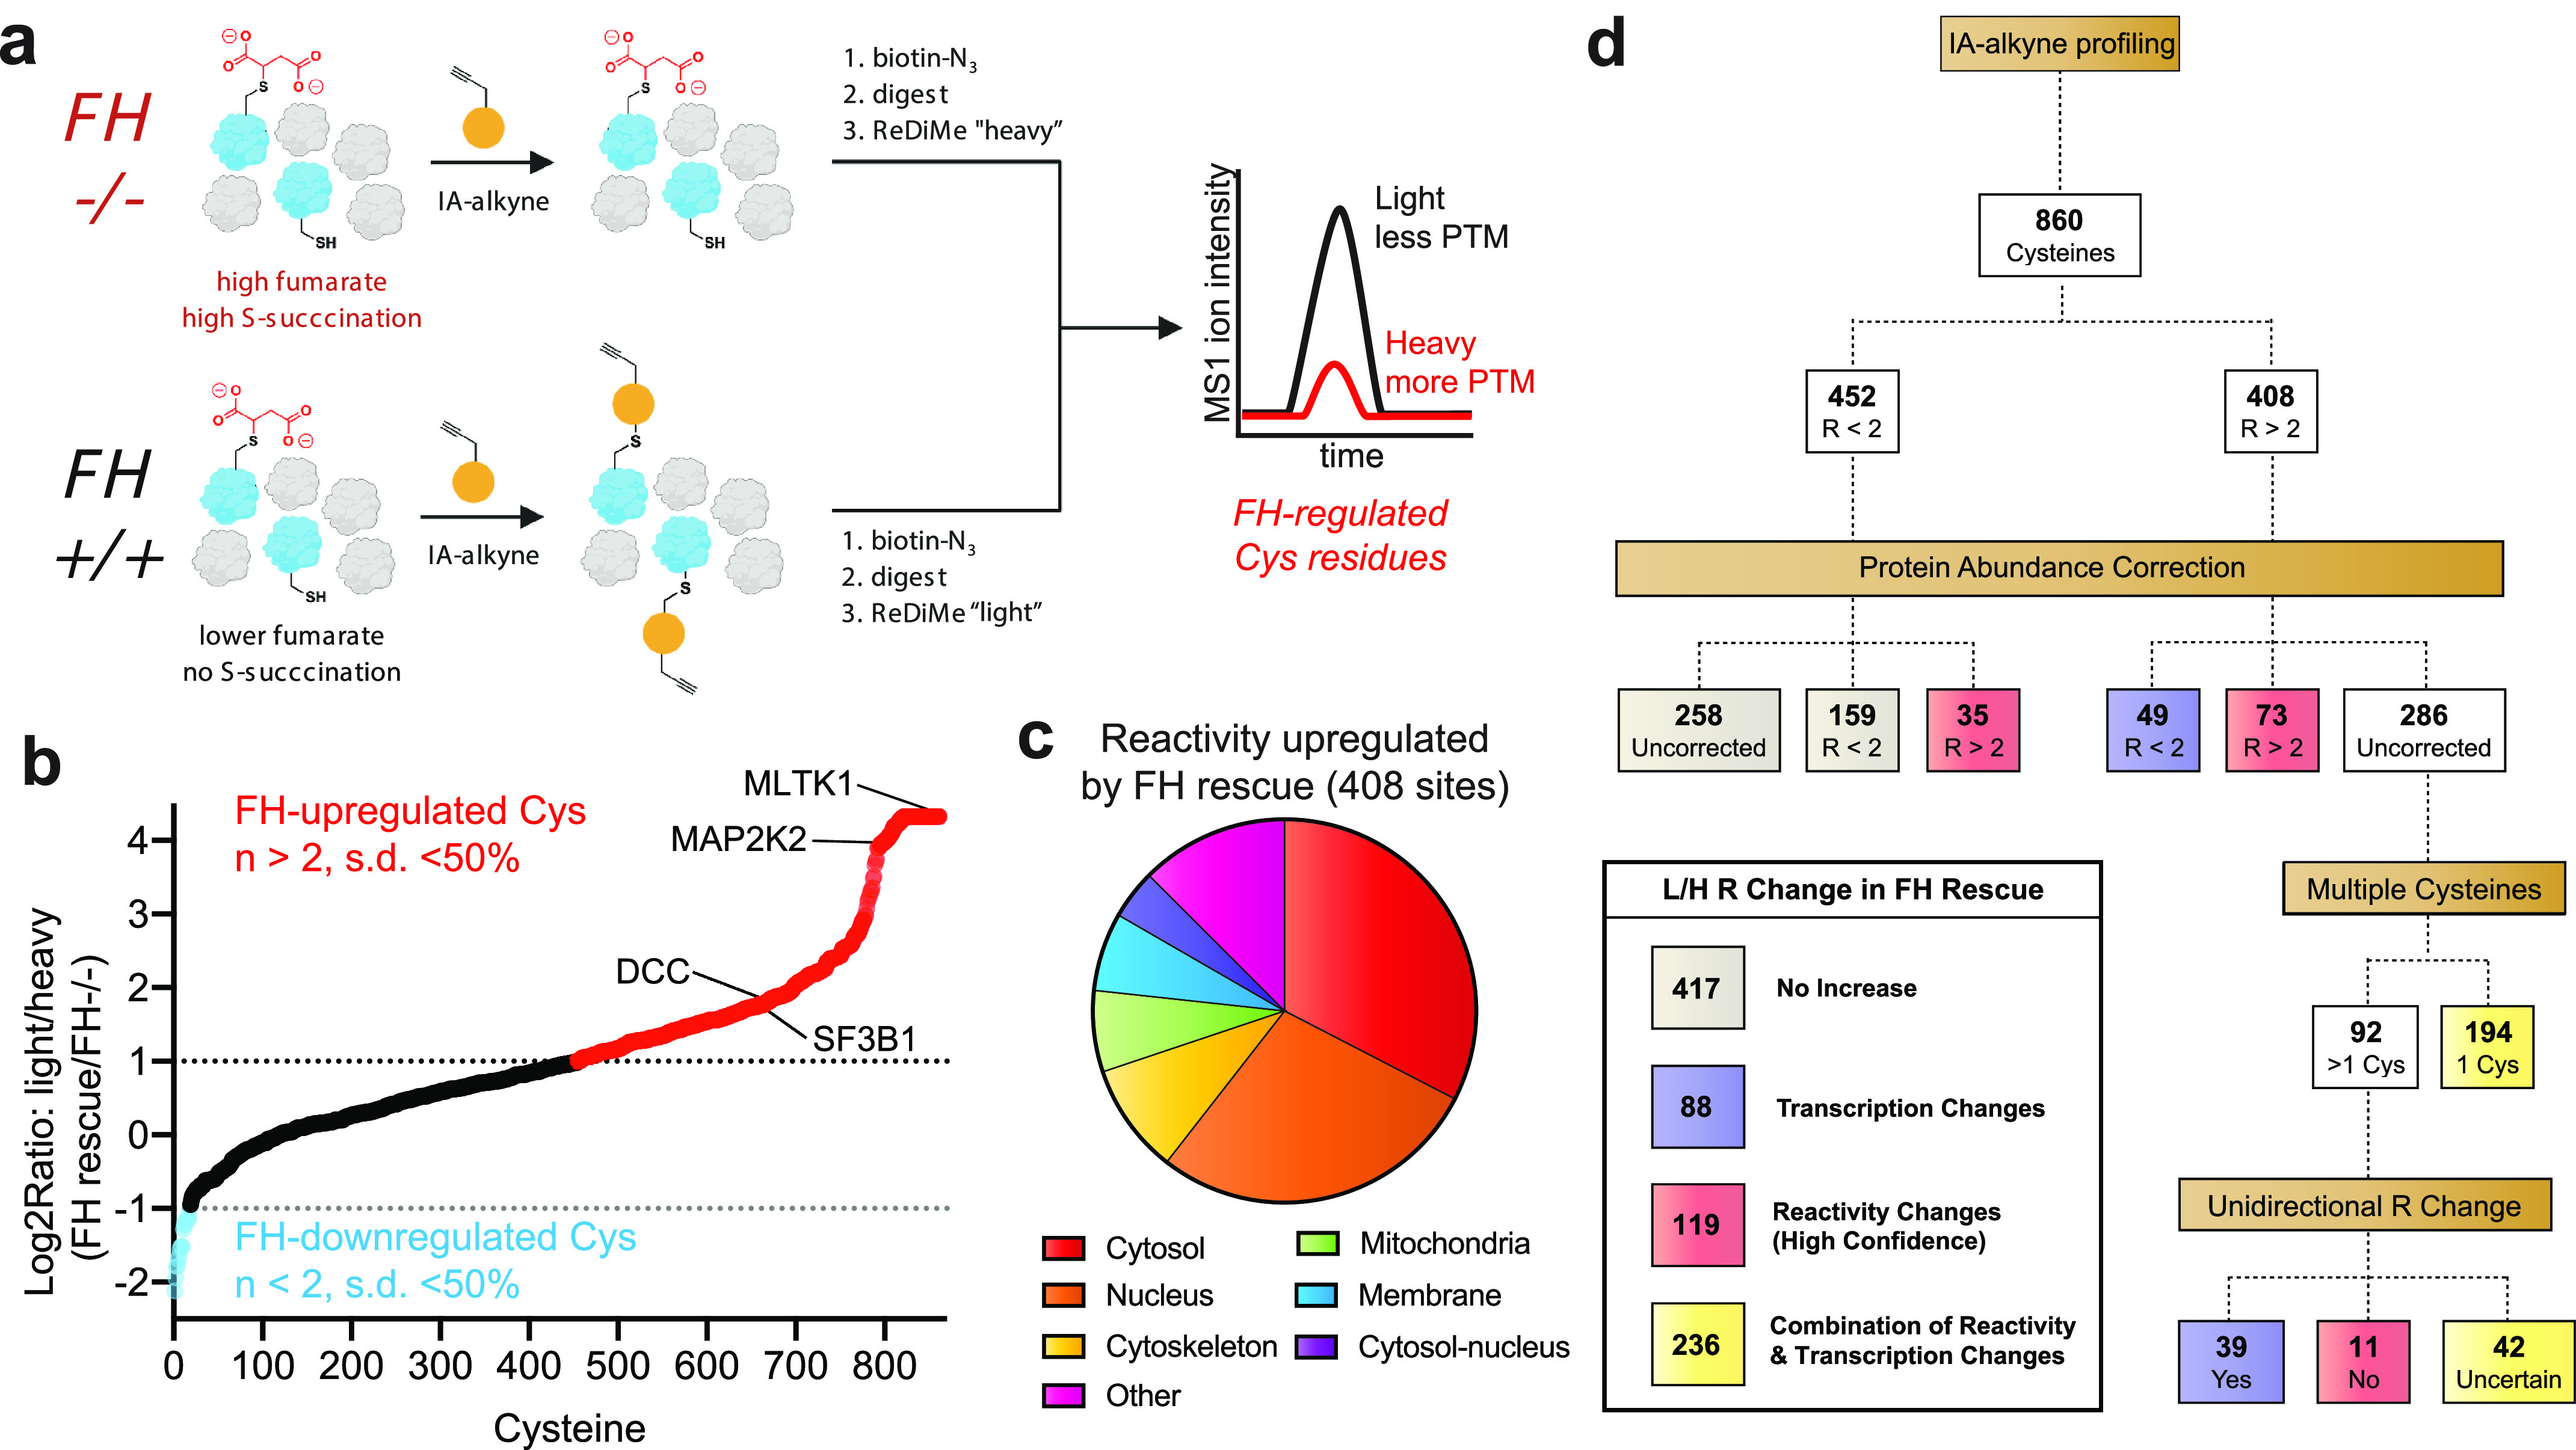
Figure 2.

Defining the consequences of FH rescue in HLRCC via quantitative cysteine reactivity profiling. a, general workflow for reactive cysteine–profiling experiment. FH−/−, FH mutant cells; FH+/+, FH rescue cells. b, graph of quantified cysteine reactivity in FH−/− (heavy) and FH+/+ (light) UOK268 cell lines, sorted from high to low peptide R values. c, cellular localization of cysteine residues up-regulated by FH rescue (R ≥ 2, S.D. ≤ 50%). d, flow chart describing how protein abundance correction and the presence of multiple cysteine residues in a single protein were used to define cysteine reactivity changes likely to be driven by FH-dependent transcription (purple), FH-dependent reactivity (red), and a combination thereof (yellow).
