
Figure 6.
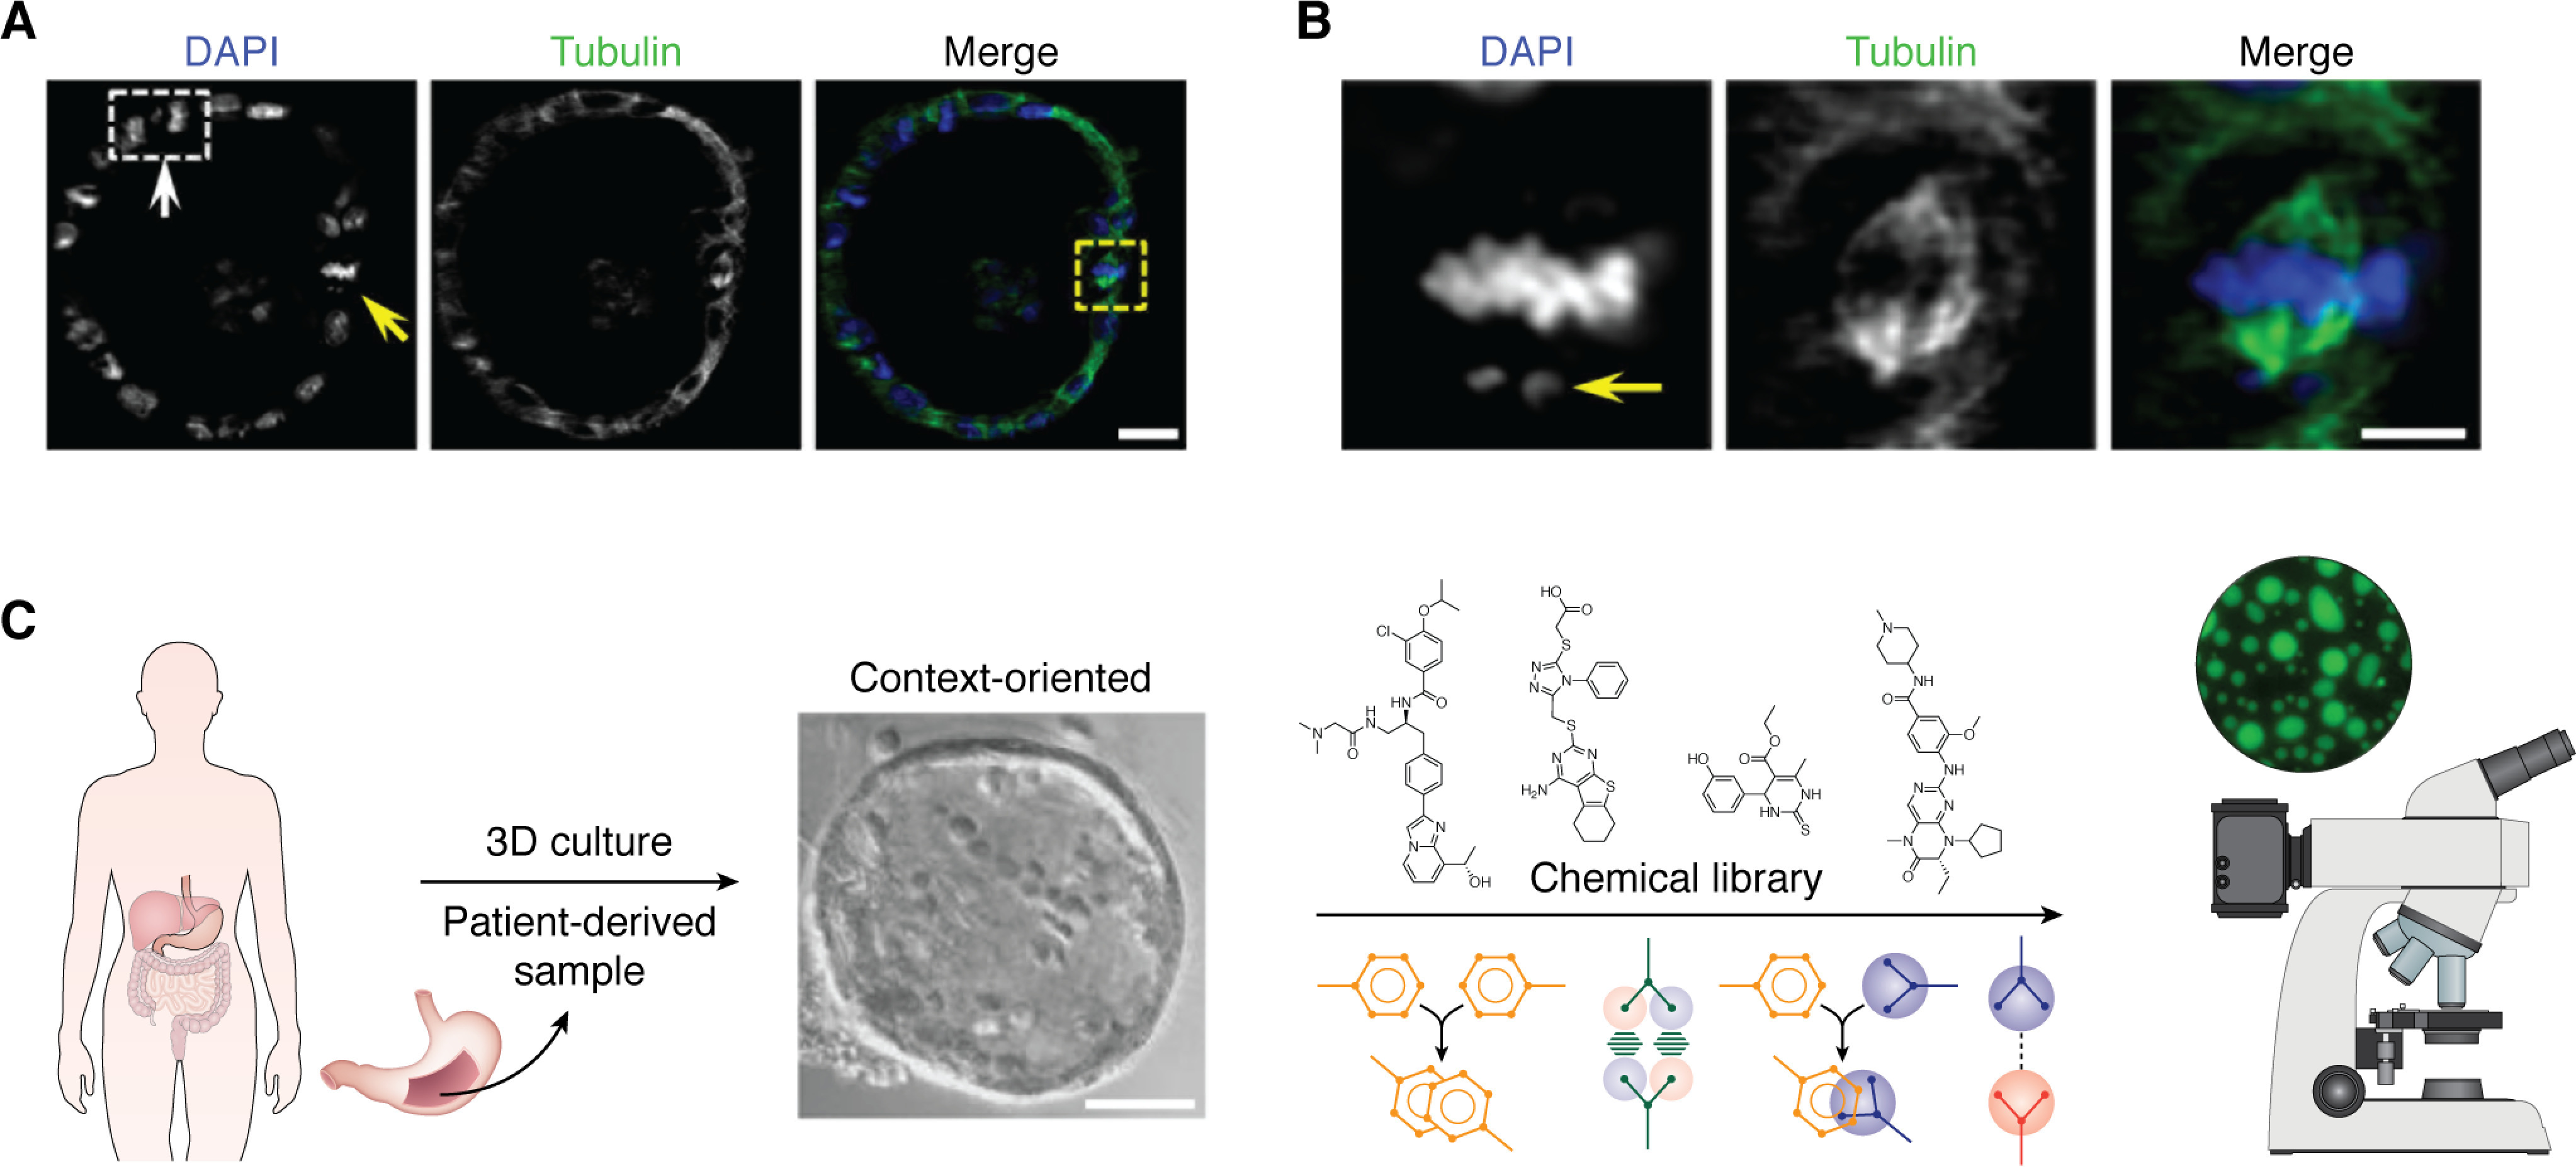
Three-dimensional organoids for modeling spatiotemporal dynamics of membraneless organelles in healthy and disease contexts. A, mouse gastric organoids were fixed for immunocytochemical staining of α-tubulin (green) and DNA staining with 4′,6-diamidino-2-phenylindole (DAPI) (blue). The light-sheet micrograph shows two mitotic cells, indicated by arrows, which contain one anaphase cell (white box, white arrow) and three metaphase cells (yellow arrow). Visualization of chromosome segregation in gastric organoids is used to study chromosome stability and establishment of polarity during cell renewal and progression of tumor cells in response to extracellular cues such as cytokines. Light-sheet micrography of gastric epithelial and stem cells can be used to study their responses to various extracellular cues or therapeutic agents. For example, organoids derived from gastric cancer cells of patients might be used to identify the most effective treatments. Real-time spectral imaging could be used to study the effects of various combinations of agents (adapted from Ref. 73). Scale bar, 20 μm. B, magnified image from A. This mitotic metaphase cell has a lagging chromosome and spindle orientation error (arrow). This image demonstrates that a combination of light-sheet microscopy with 3D organoids allows high-resolution imaging of single chromosome dynamics in a 3D context (adapted from Ref. 73). Scale bar, 10 μm. C, schematic illustration showing how human patient–derived samples can be used to visualize membraneless organelle dynamics and formation of coacervates and a chemical biological screen for compounds and/or regimens tailored to regulate LLPS for precision and combination therapeutics of cancers without targeted therapy (adapted from Ref. 73).