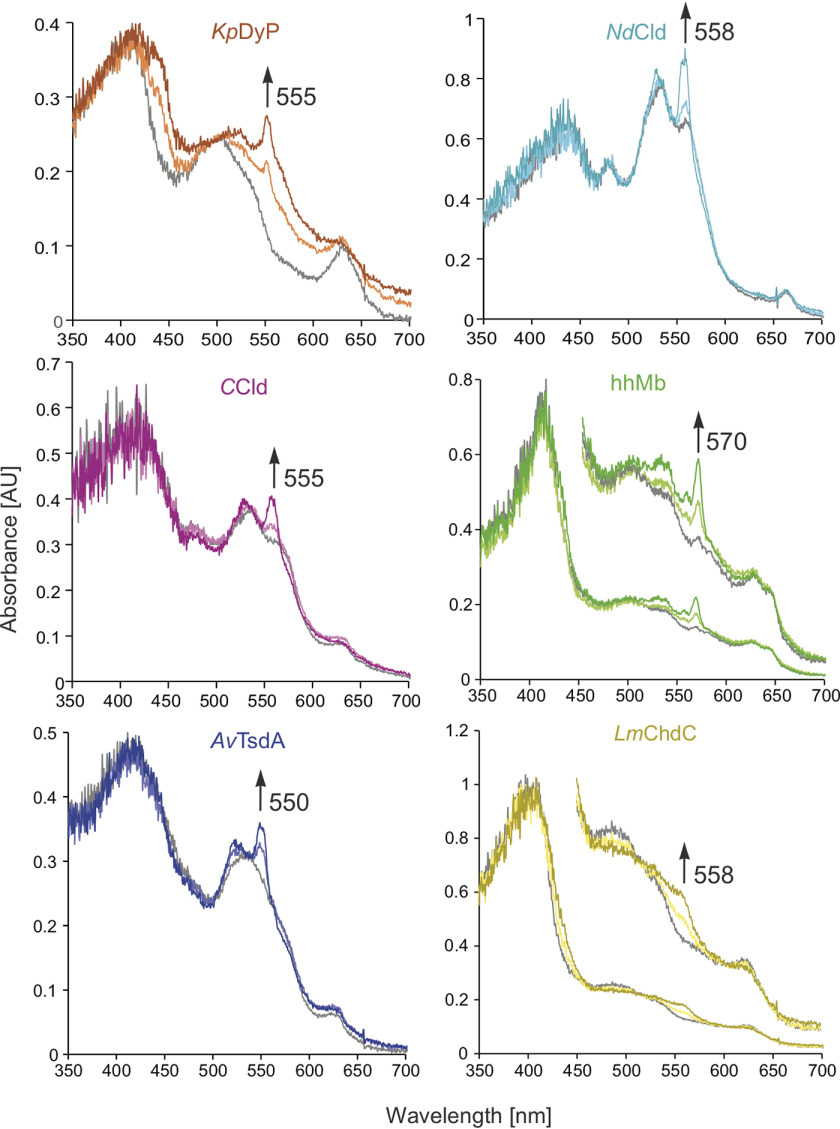
Figure 3.
Online microspectroscopy. Overlay of single-crystal UV-visible spectra obtained from online microspectroscopy (10% transmission) of the ferric (gray), ∼50% reduced (lightly shaded), and final (fully reduced, dark shaded) crystals of KpDyP (orange), NdCld (turquoise), CCld (pink), hhMb (green), AvTsdA (blue), and LmChdC (yellow). Arrows indicate the distinct increase in absorbance at the wavelength that was used to monitor the progress of photoreduction.

