Figure 4.
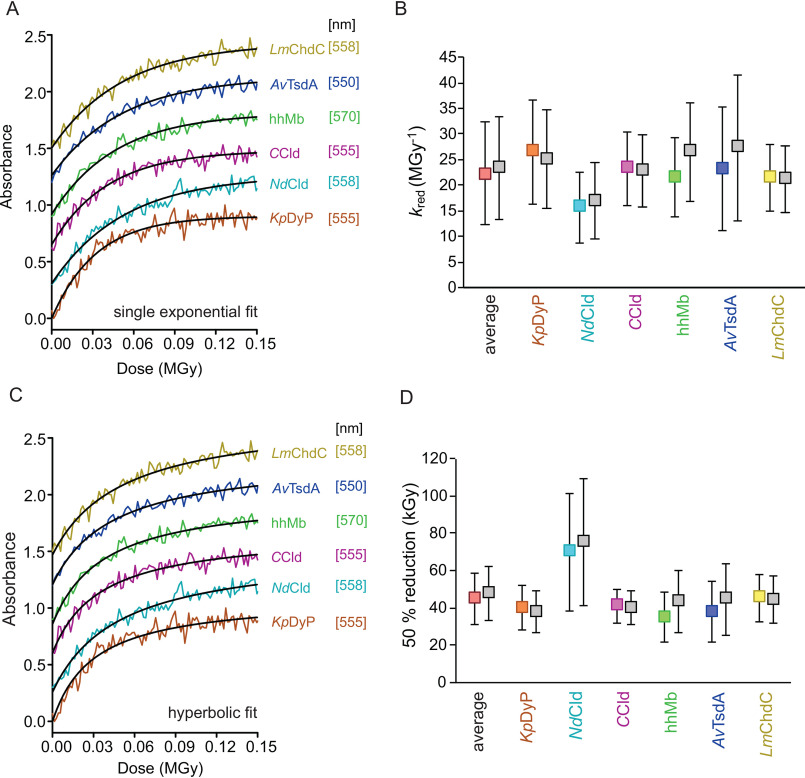
Kinetics of radiation-mediated reduction of Fe(III) to Fe(II). A, representative dose traces (at 5% transmission) with single-exponential fits to derive the rate of reduction (kred). B, rates of reduction (kred) for all proteins in the respective color and the calculated average for all six proteins (in red). C, representative dose-dependent changes of absorption at protein-specific wavelength (see Fig. 3) at 5% transmission (flux: 2.1 × 10¹¹ photons s−1) with hyperbolic fits to derive the dose of half-maximal reduction. D, doses needed to reduce the heme iron in the protein crystals to obtain 50% ferric and ferrous heme (average value for all proteins in red). Dose traces in A and C were lifted by multiples of 0.3 for each sample for better visibility. Plotted values in B and D calculated using RADDOSE-3D version 4.0 with individual input for all different samples are shown in the respective color for each sample. Calculations using RADDOSE-3D version 4.0 input from a generic heme protein crystal are shown in gray beside the respective individual data points (KpDyP in orange, NdCld in turquoise, CCld in pink, hhMb in green, AvTsdA in blue, and LmChdC in yellow). Error bars, S.D.

