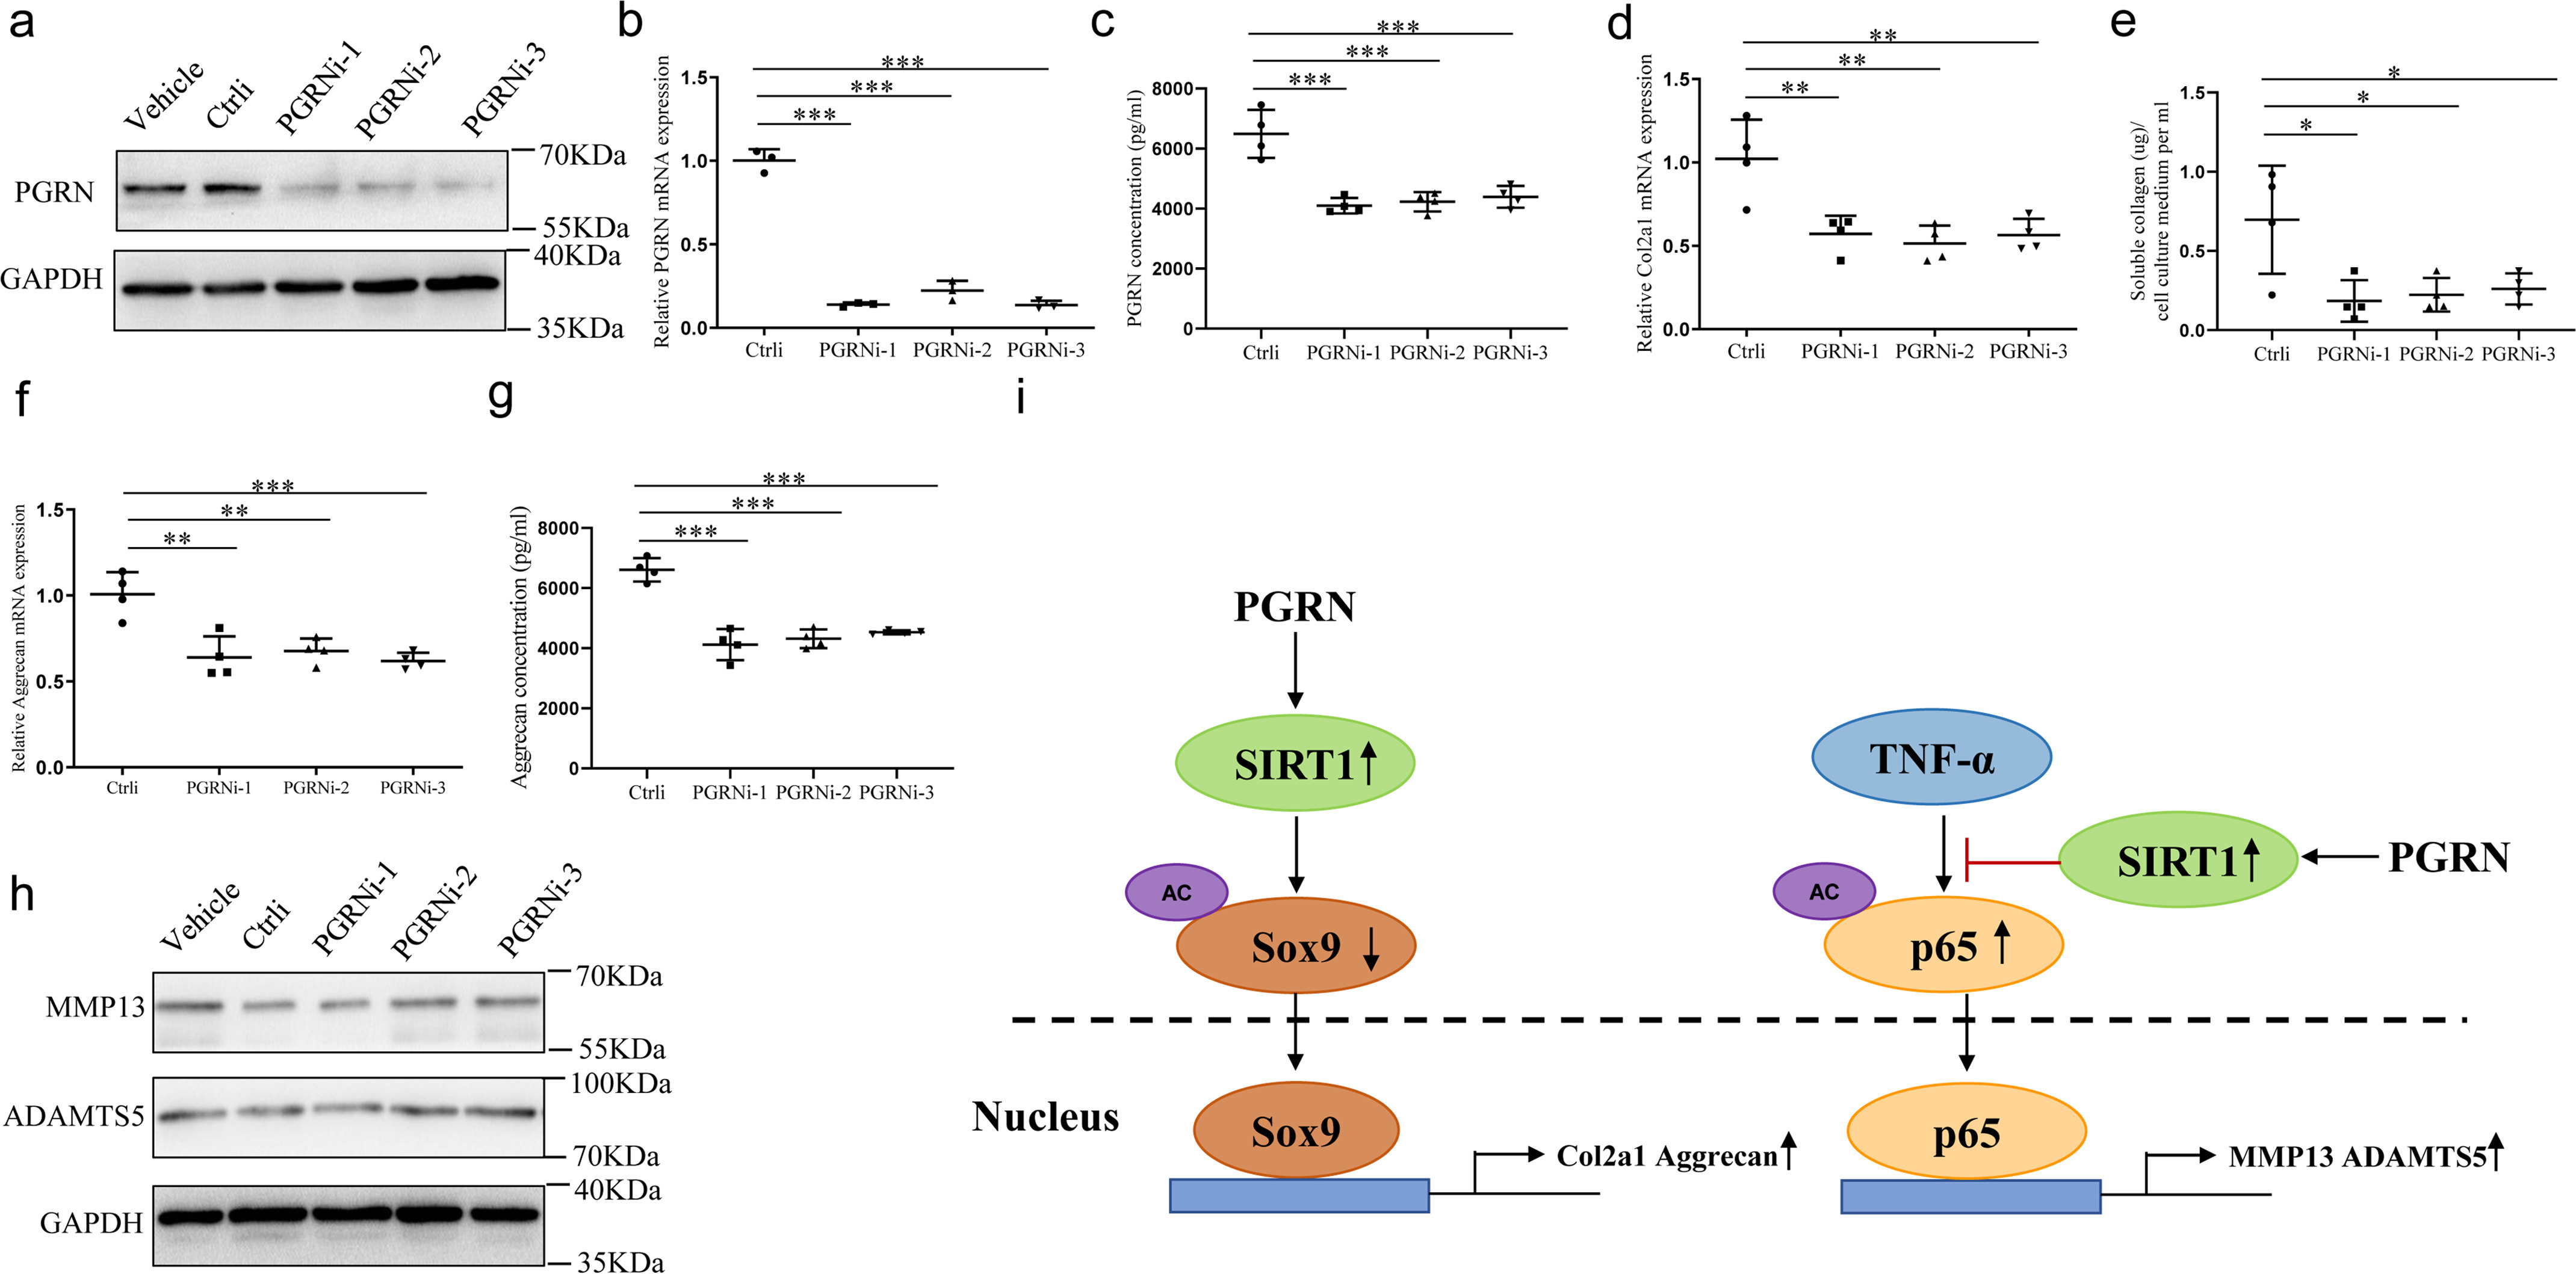
Figure 6.

Effects of endogenous PGRN on cartilage gene expression. Chondrocytes were transfected with control siRNA or PGRN siRNA for 48 h. a and b, the protein and mRNA levels of PGRN were measured. PGRNi-1, PGRNi-2, and PGRNi-3 indicate three independent siRNAs against PGRN. One-way ANOVA and Tukey's multiple comparison test. c, PGRN secretion was detected by ELISA in the conditioned medium of chondrocytes. One-way ANOVA and Tukey's multiple comparison test. d and e, COL2A1 expression and secretion were detected by real-time PCR and soluble collagen quantification assay. One-way ANOVA and Tukey's multiple comparison test. f and g, aggrecan expression and secretion were detected by real-time PCR and ELISA. One-way ANOVA and Tukey's multiple comparison test. h, levels of MMP13 and ADAMTS5 were analyzed by Western blotting. i, model depicting the molecular mechanism that PGRN plays an important role in maintaining chondrocyte homeostasis. Data were expressed as mean ± S.D. in each scatterplot. *, p < 0.05; **, p < 0.01; ***, p < 0.001.
