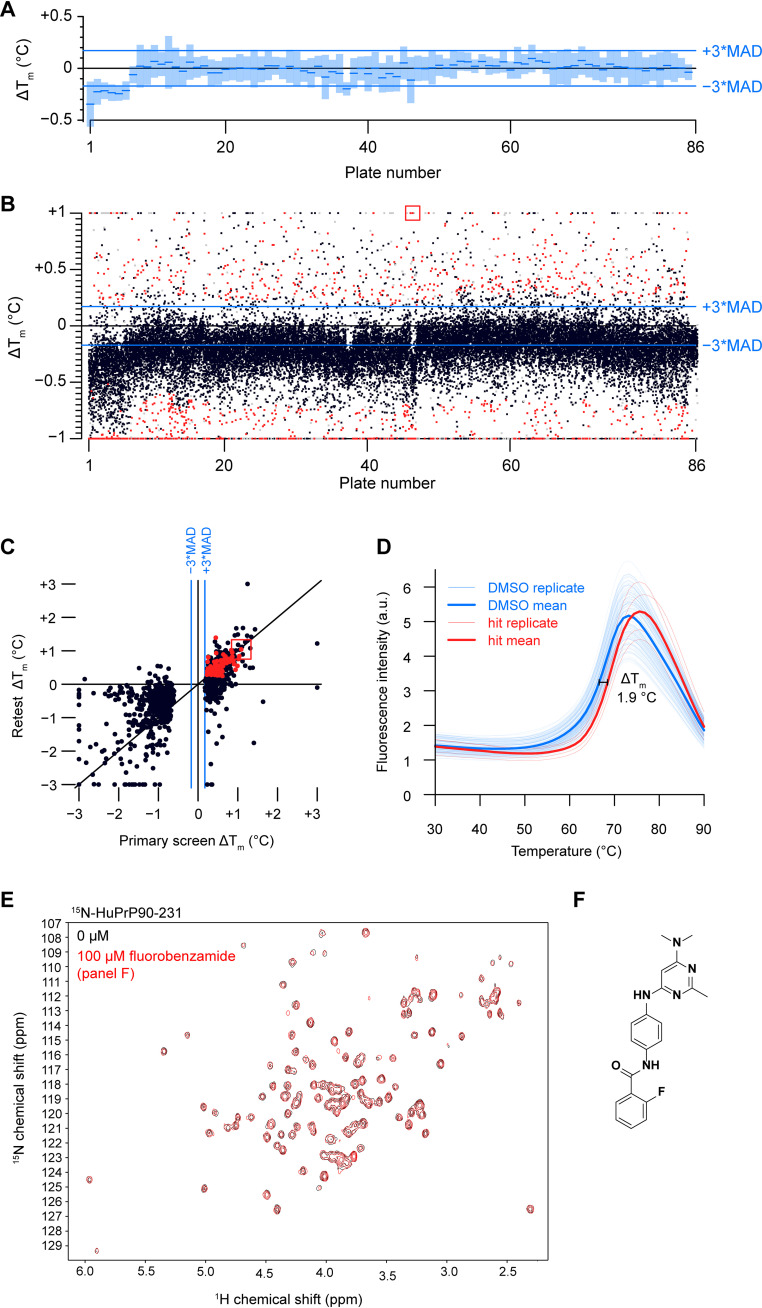
Figure 3.
Thermal shift screening. A, a box plot of the HuPrP90-231 median Tm (blue dash) for the DMSO controls from each of the 86 384-well plates screened. These values are relative to the median from all plates combined. Light blue rectangles around each median represent ±3× MAD. B, scatter plot of ΔTm data from the initial screen with red dots indicating hits that were screened in triplicate. Red dots were compounds called as hits (see Experimental procedures for details). Gray dots were compounds that were flagged for having melt curve analysis errors. Black dots are compounds that did not meet our hit calling threshold but were not flagged. Compounds that resulted in PrP shifts of greater than or less than one degree were plotted at +1 or −1, respectively. C, scatter plot of ΔTm values from primary screening versus triplicate screening data. D, fluorescence melt curves of HuPrP90-231 with DMSO and a positive ΔTm shifter (fluorobenzamide shown in panel F). n = 128 for DMSO and n = 4 for test compound. E, HSQC spectrum of 15N-HuPrP90-231 with hit (fluorobenzamide shown in panel F; 100 μm). F, chemical structure of selected fluorobenzamide hit, boxed in red in panels B and C.

