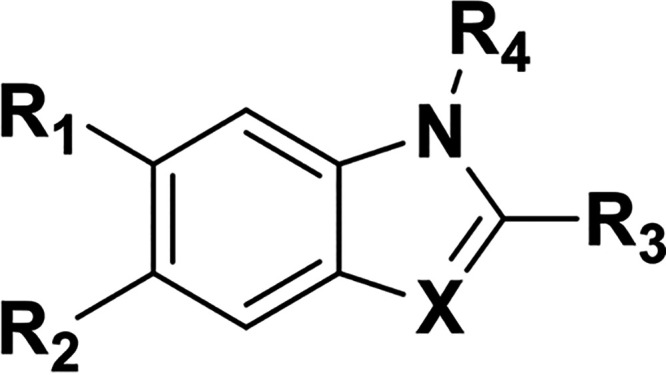
Table 2.
Analogs of compound 1 tested by STD and TROSY NMRa
| Compound |
 |
STD | TROSY | ||||
|---|---|---|---|---|---|---|---|
| R1 | R2 | R3 | R4 | X | |||
| 1 | Cl | Cl | Me | H | N | + | + |
| 2 | Me | Me | Me | H | N | + | − |
| 3 | F | F | Me | H | N | − | ± |
| 4 | H | CN | Me | H | N | − | − |
| 5 | Cl | Cl | OH | H | N | − | ± |
| 6 | Cl | Cl | H | H | N | + | + |
| 7 | Cl | H | Me | H | N | − | − |
| 8 | Cl | Cl | Et | H | N | + | + |
| 9 | Cl | Cl | Me | Et | N+-Et | − | ± |
| 10 | Cl | Cl | Me | Me | N | + | + |
| 11 | Br | Cl | H | H | N | + | ± |
| 12 | Br | Br | H | H | N | + | ± |
| 13 | Cl | Cl | CH2OH | H | CH | + | ± |
| 14 | Cl | Cl | H | H | CH | + | ± |
| 15 | Cl | Br | H | H | CH | + | ± |
| 16 | Cl | OMe | H | H | CH | ± | |
| 17 | OMe | Cl | H | H | CH | − | |
| 18 | Cl | F | H | H | CH | − | |
| 19 | F | Cl | H | H | CH | ± | |
| 20 | Br | Cl | H | H | CH | + | ± |
a Analogs of 1 were initially tested by STD NMR, and positive STD hits were assayed by TROSY. + indicates positive STD or TROSY signal; − indicates no STD or TROSY signal; ± indicates borderline positive signal. Blank cells indicate that the analog was not tested. All spectra were assessed by visual inspection.
