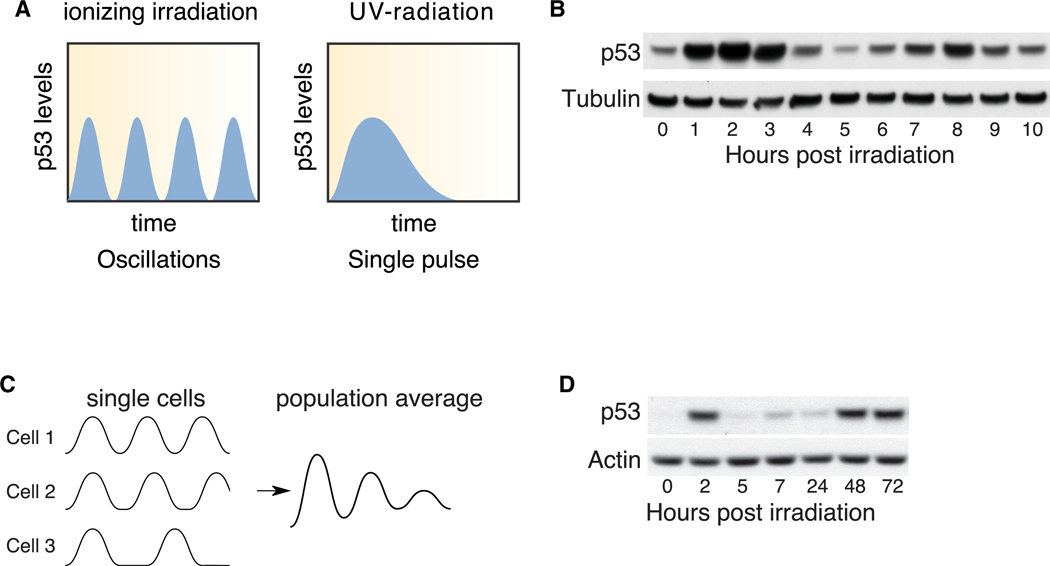
Figure 1. p53 Protein Levels Exhibit a Late-Phase Increase Following Irradiation.
(A) Schematic of p53 dynamics following ionizing irradiation or UV treatment.
(B) p53 protein levels at the indicated time points following 10 Gy ionizing irradiation. Tubulin is shown as a loading control.
(C) Schematic of possible p53 dynamics in single cells. All cells initiate a p53 response in a synchronous manner but later lose synchrony, resulting in signal decay as measured in population assays.
(D) p53 levels up to 72 h following 10 Gy ionizing irradiation. Actin is shown as a loading control.

