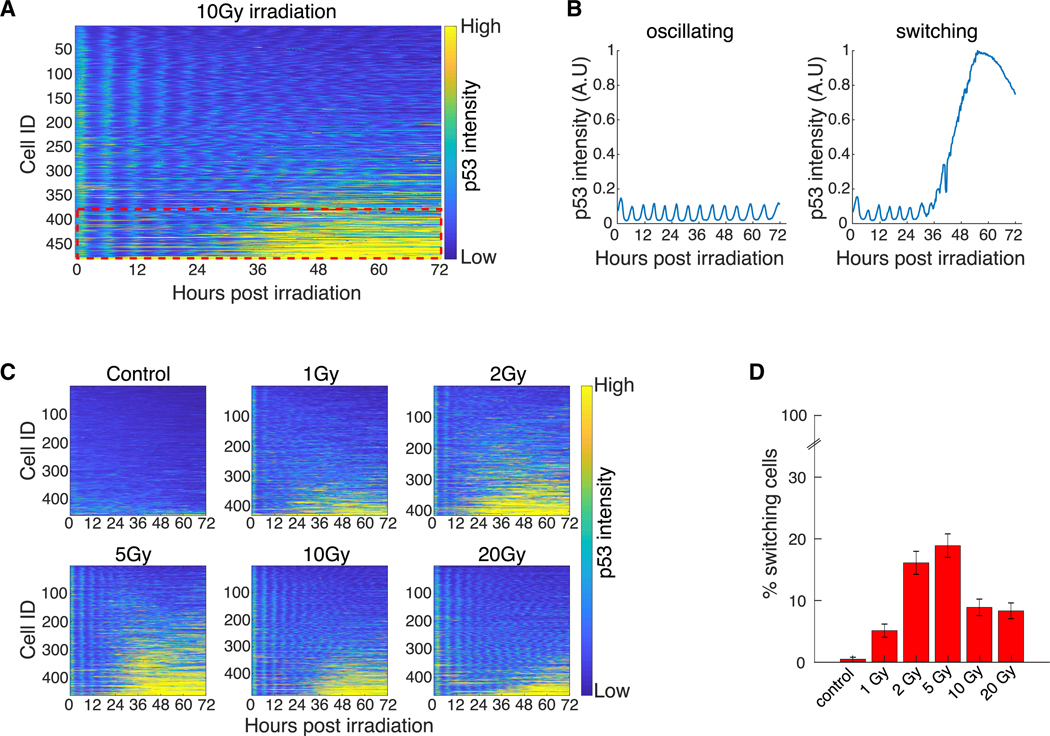
Figure 2. Only a Subset of Cells Switches p53 Protein Levels from Oscillatory to Elevated.
(A) Heatmap of scaled p53-Venus fluorescence intensity in single cells following 10 Gy irradiation. Cells were tracked for 72 h (x axis) and sorted by mean p53 intensity (y axis). Each row on the y axis represents a single cell. Fluorescence intensity is color coded from blue (low intensity) to yellow (high intensity). Red dotted rectangle highlights the subset of cells that switches from low to high p53 intensity.
(B) Example p53 trajectories of oscillating and switching cells.
(C) Heatmaps of scaled p53-Venus fluorescence intensity in single cells following increasing doses of irradiation, plotted as described in (A).
(D) Percent of cells that exhibit p53 switching as determined by k-means clustering. All doses were clustered together (approximately 400 cells per dose; see C), and only cells with 95% confidence were counted (see Materials Availability and Method Details). Error bars represent standard error of the proportions.
See also Figure S1.

