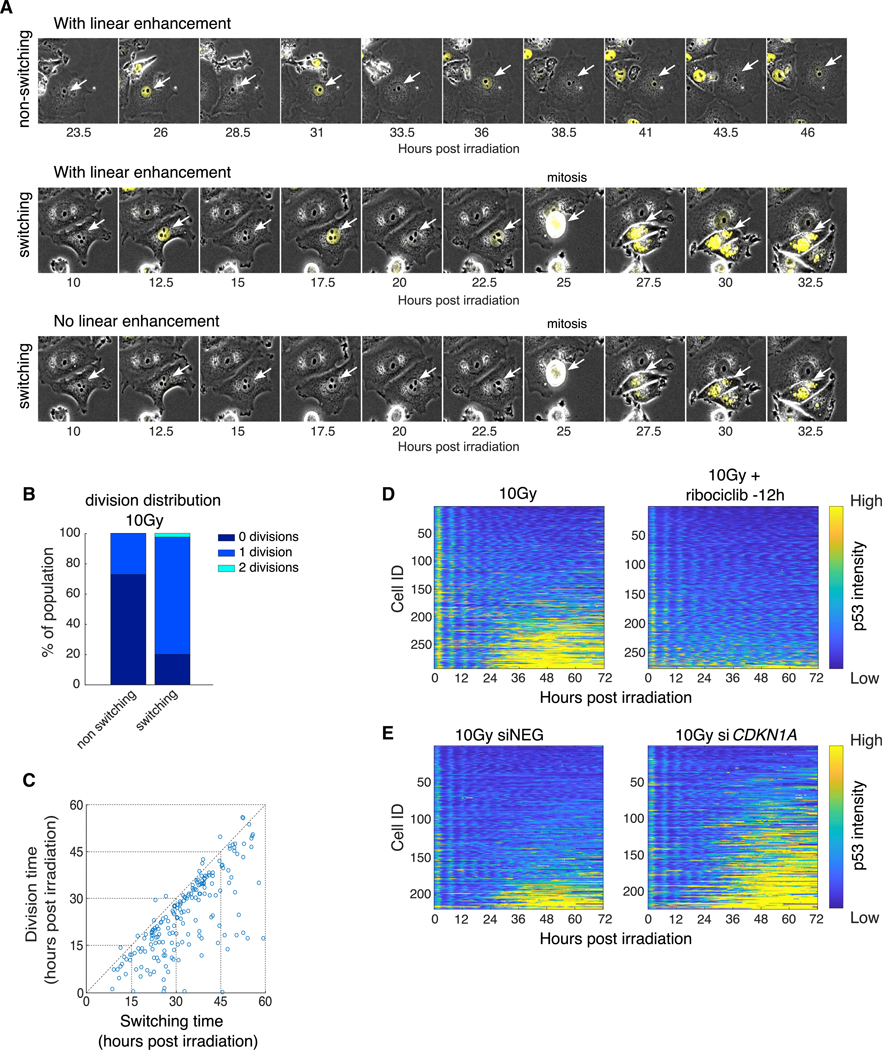
Figure 3. Failure to Maintain DNA-Damage-Induced Arrest Leads to the Switch in p53 Dynamics.
(A) Representative cells showing non-switching (top) and switching (middle and bottom) behavior following 10 Gy irradiation. Middle and bottom panels show the same cells with (middle) and without (bottom) linear signal enhancement. p53-Venus intensity is shown in yellow, and white arrows mark the tracked cells.
(B) Distribution of the number of divisions undergone by switching and non-switching cells during the 72-h time course following 10 Gy irradiation.
(C) Scatterplot of the time of division (y axis) versus the time of switching (x axis). Only switching cells that divided were plotted (r = 0.71; p = 2.4173E – 31).
(D) Heatmaps of scaled p53-Venus fluorescence intensity in cells subjected to 10 Gy irradiation with (right panel) or without (left panel) ribociclib (10 μM, 12 h prior to irradiation, right panel).
(E) Heatmaps of scaled p53-Venus fluorescence intensity in cells subjected to 10 Gy irradiation followed by treatment with control (left) or CDKN1A (right) siRNA 2 h after irradiation.
In (D) and (E), heatmaps are plotted as described in Figure 2A.
See also Figures S2 and S3.

