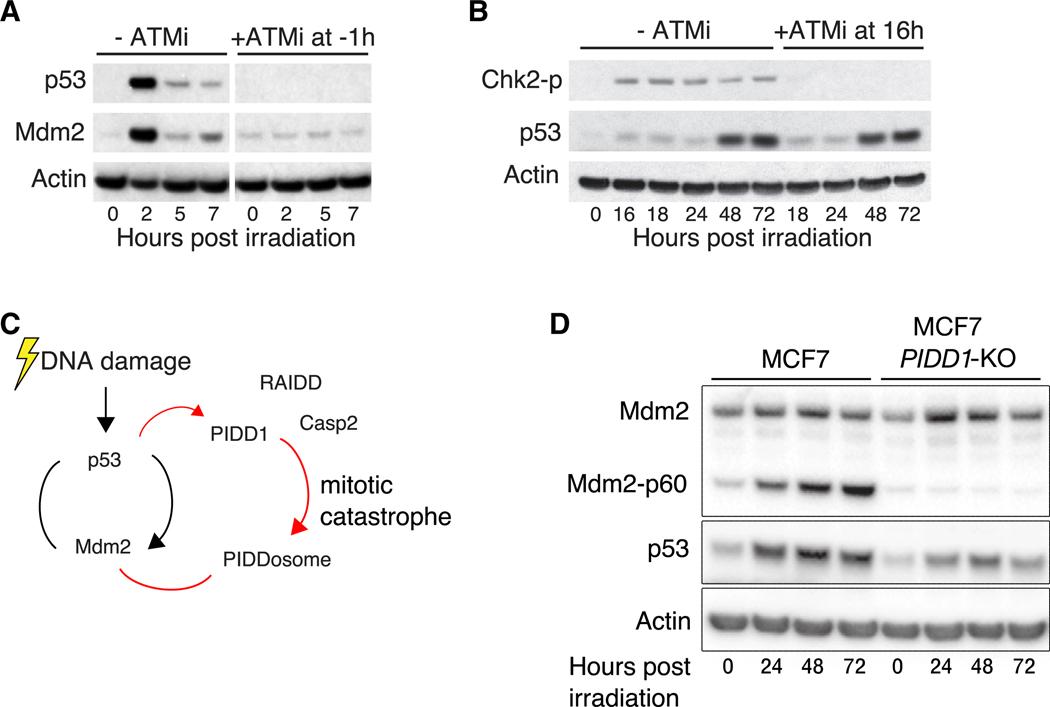
Figure 4. The Caspase-2-PIDDosome Contributes to the Switch in p53 Dynamics.
(A) Western blot showing p53 and Mdm2 levels with or without ATM inhibitor (KU55933 10 μM) added 1 h prior to irradiation. Mdm2 levels represent p53 activity. Actin is shown as a loading control.
(B) Western blot showing p53 levels with or without ATM inhibition 16 h following irradiation. Chk2 phosphorylation is used to measure ATM activity. Actin is shown as a loading control.
(C) Schematic of the caspase-2-PIDDosome interaction with the p53-Mdm2 network following irradiation.
(D) p53 levels following CRISPR/Cas9 KO of PIDD1. Actin is shown as a loading control.
See also Figure S4.

