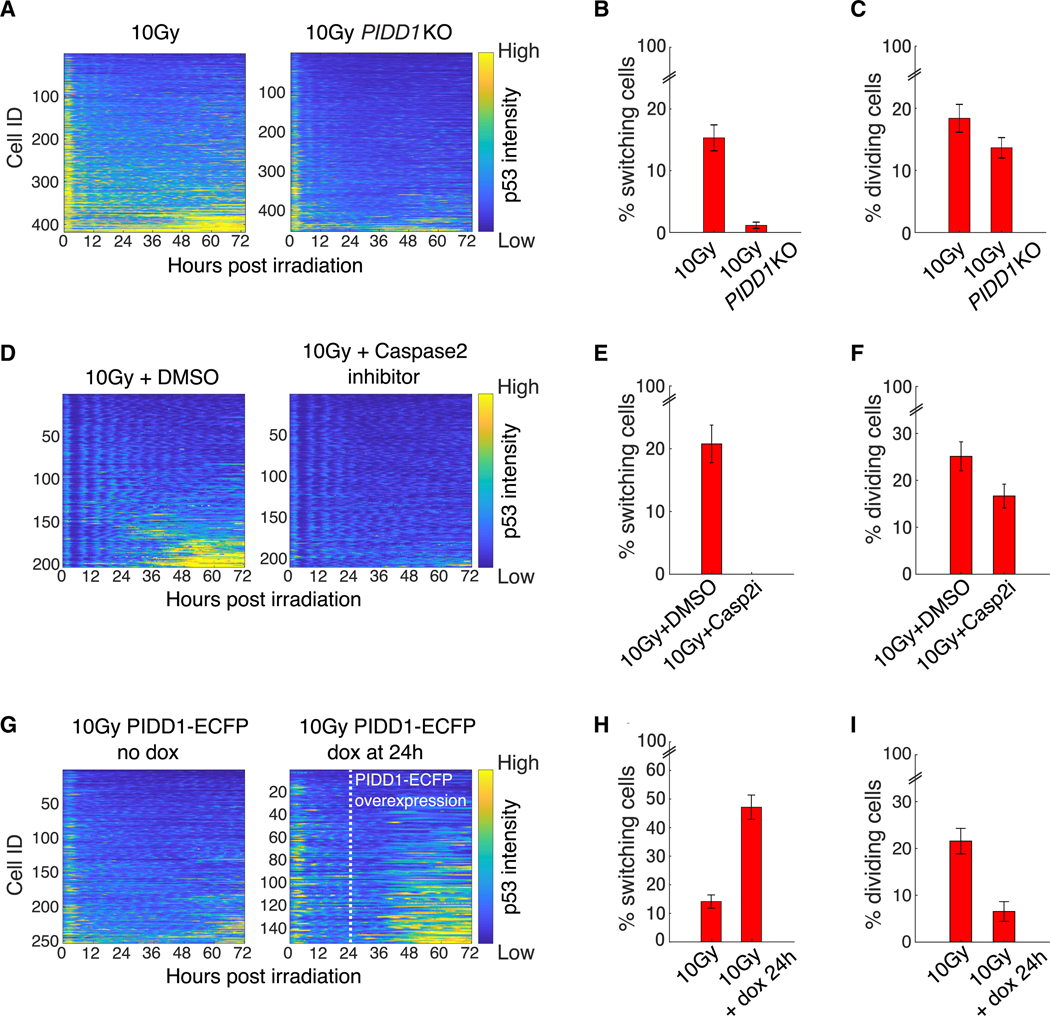
Figure 5. Manipulating the Caspase-2-PIDDosome Alters Switching.
(A) Heatmaps of scaled p53 intensity in the PIDD1 KO cell line (right panel) and control (left panel).
(B) Percent of switchers in control (n = 418 cells) and PIDD1 KO (n = 454 cells) populations as determined by k-means clustering.
(C) Percent of dividing cells in control (n = 418 cells) and PIDD1 KO populations (n = 454).
(D) Heatmaps of scaled p53 intensity following caspase-2 inhibition with 100 μM NH-23-C2 (right panel) or DMSO (control, left panel).
(E) Percent of switchers in control (n = 203 cells) and NH-23-C2 (n = 210 cells) populations as determined by k-means clustering.
(F) Percent of dividing cells in control (n = 203 cells) and NH-23-C2-treated (Casp2i) populations (n = 210).
(G) Heatmaps of scaled p53 intensities in PIDD1-overexpressing cells. Left panel is the uninduced control. In the right panel, PIDD1 was induced with doxycycline addition 24 h following irradiation (white dashed line).
(H) Percent of switchers in the control (n = 253 cells) and PIDD1-overexpressing cells (n = 153 cells) as determined by k-means clustering.
(I) Percent of cells that divided in the control (n = 253 cells) and PIDD1-overexpressing cells (n = 153 cells).
(B, C, E, F, H, I) Error bars represent standard error of the proportions.
See also Figure S4.

