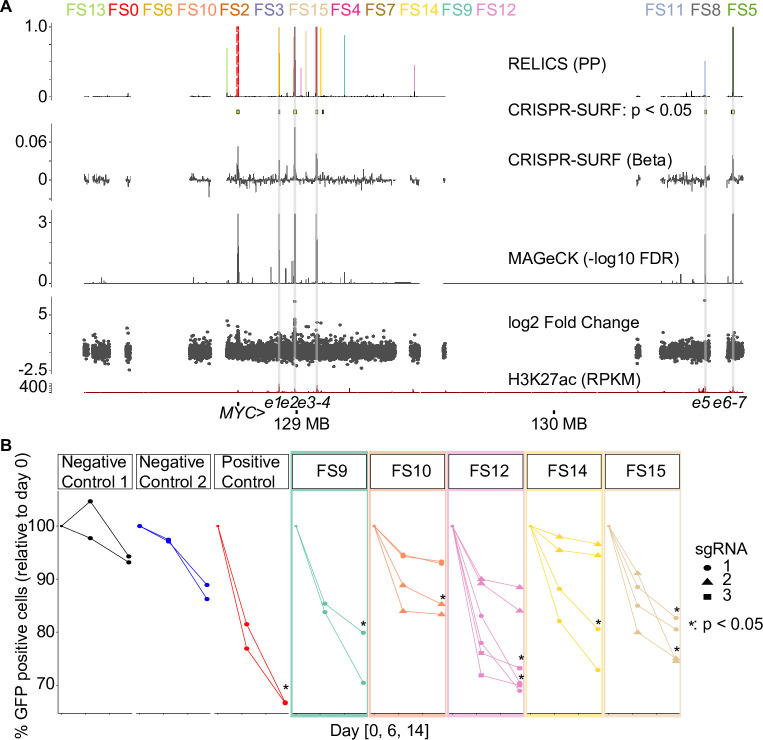
Fig 4. Analysis of a MYC CRISPRi cellular proliferation screen published by Fulco et al. 2016.
(A) Output of RELICS and other analysis methods. Each FS predicted by RELICS is given a different color and the labels are arranged by genomic position. (B) Experimental validations. Each validation experiment is a cellular proliferation assay, in which the percent of GFP-positive cells (i.e. those that received the sgRNA) are measured at day 0, day 6 and day 14. As negative controls we used dCas9:KRAB only (no sgRNA) as well as sgRNAs targeting a ‘safe harbor’ non-functional region on chromosome 8. As positive controls we used sgRNAs targeting a known regulatory region (e2, identified by Fulco et al., corresponding to FS2 and FS3). Each functional sequence was targeted with either one, two, or three different sgRNAs with two replicates each. sgRNAs that resulted in a significant reduction in % GFP compared to negative controls (dCas9 only, Neg. Ctrl.) at day 14 have an asterisk (Student’s one-sided t-test, p < 0.05).

