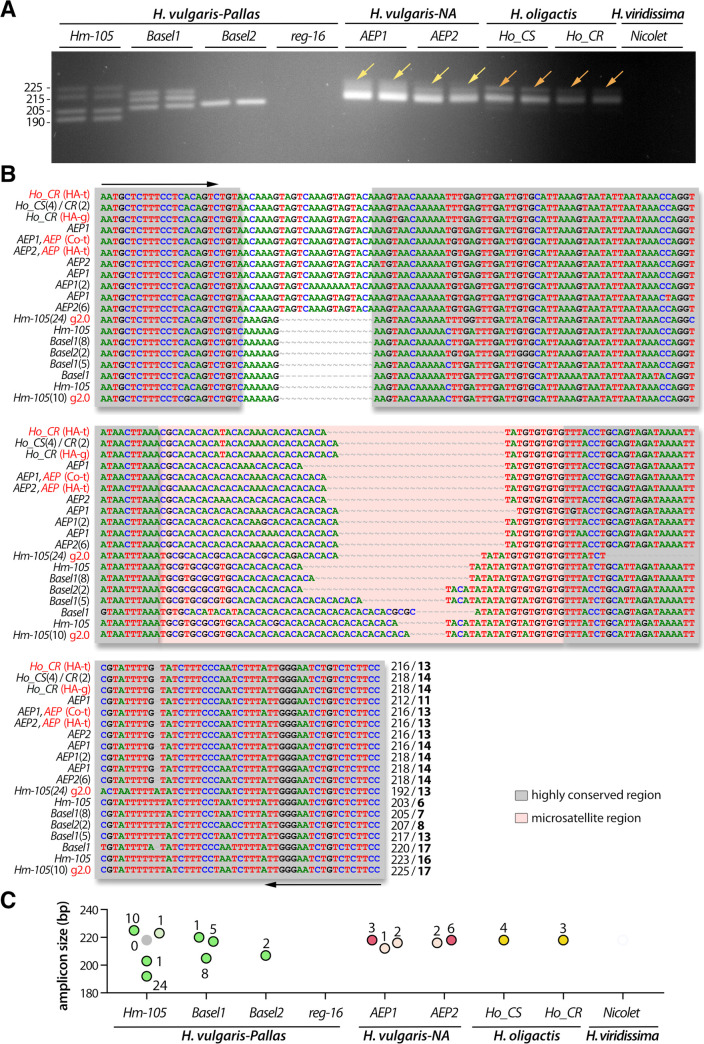
Fig 4. Analysis of the polymorphism of the TG-rich microsatellite c25145 sequence (ms-c25145).
(A) Amplification of the ms-c25145 genomic sequences from 7/9 tested strains that represent H. vulgaris-Pallas (Hm-105, Basel1, Basel2 strains), H. vulgaris-NA (AEP1, AEP2 strains) and H. oligactis (Ho_CR, Ho_CS strains). Yellow arrows point to a smear detected in both AEP1 and AEP2, orange arrows point to a faint second band detected in both Ho_CS and Ho_CR. (B) Sequence alignment of the ms-c25145 region. The salmon-pink color box indicates the central TG-rich microsatellite region embedded within highly conserved regions (grey boxes). Primer sequences used for amplification are indicated with black arrows. Numbers in brackets after the strain name indicate the number of independent positive sequencings, numbers at the 3’ end indicate the size of the PCR product and the number of TG-repeats (bold). Red writings indicate transcriptomic (t) or genomic (g) sequences available on the HydrATLAS (HA) server [32, 40, 41], the NHGRI Hydra web portal for the Hydra 2.0 genome (g2.0) [34] and Juliano transcriptomes (Jul) [38] or the Compagen (Co) server [37, 42] (see S2 Table). (C) Graphical representation of the different ms-c25145 amplicons as deduced from sequencing data. Each dot corresponds to a distinct amplicon confirmed by one or several sequencings as indicated by the number of sequenced colonies (see S2 Table). Green, red and yellow color dots correspond to expected sizes, lighter color dots refer to sequences with errors (PCR or sequencing), the grey dot indicates missing data.

