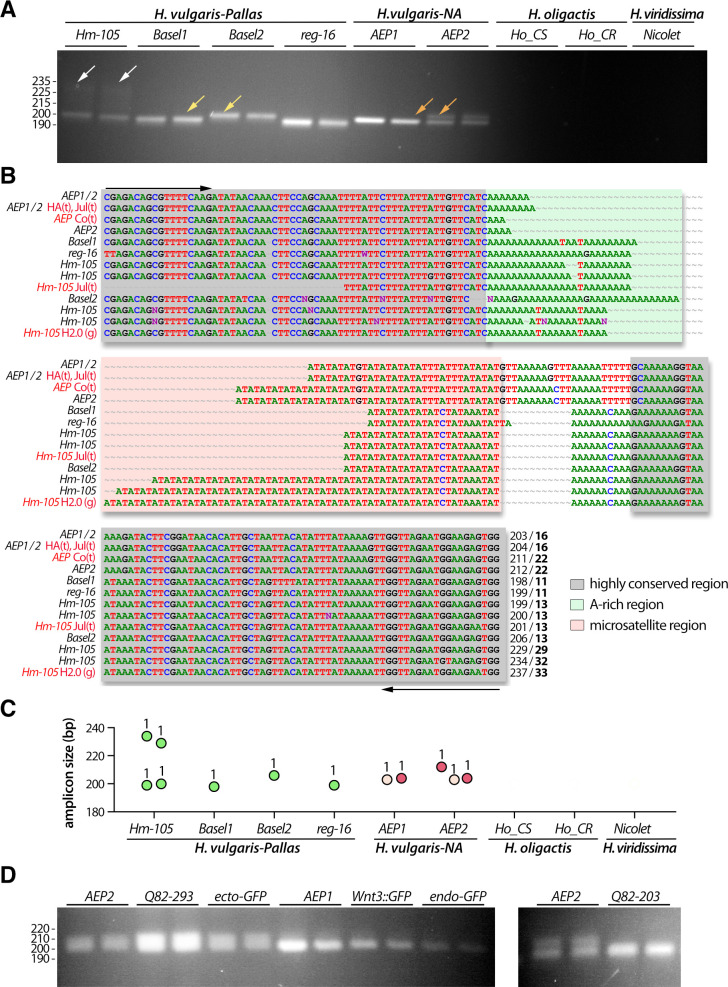
Fig 5. Analysis of the polymorphism of the AT-rich microsatellite region of the Aryl-Hydrocarbon Receptor-Interacting Protein gene (ms-AIP).
(A) Amplification of the ms-AIP genomic sequences in six out of nine tested strains, which represent two distinct H. vulgaris sub-groups, H. vulgaris-Pallas (Basel1, Basel2, Hm-105, reg-16) and H. vulgaris-NA (AEP1, AEP2). White arrows point to a faint band observed only in Hm-105 polyps, yellow arrows indicate a size difference between Basel1 and Basel2, and the orange arrows show a second band detected in AEP2 but not in AEP1. (B) Alignment of the ms-AIP sequences. The color boxes indicate the AT-rich central region (salmon-pink) and an A-rich motif (green) embedded within highly conserved regions (grey). Primer sequences used for amplification are indicated with black arrows. Numbers at the 3’ end indicate the PCR product size and the number of AT-repeats (bold). Red writings indicate transcriptomic (t) or genomic (g) sequences available on HydrATLAS (HA) [32, 40, 41], NHGRI web portal for the Hydra 2.0 genome (g2.0) [34] and Juliano transcriptomes (Jul) [38], or Compagen (Co) server [37, 42] (see S2 Table). (C) Graphical representation of the ms-AIP amplicons as deduced from sequencing data. Dot legend as in Fig 4. (D) Amplification of ms-AIP in five transgenic lines ecto-GFP and endo-GFP produced in uncharacterized AEP [42], AEP1_Wnt3 [49], AEP2_203 and AEP2_293 (QS, unpublished).

