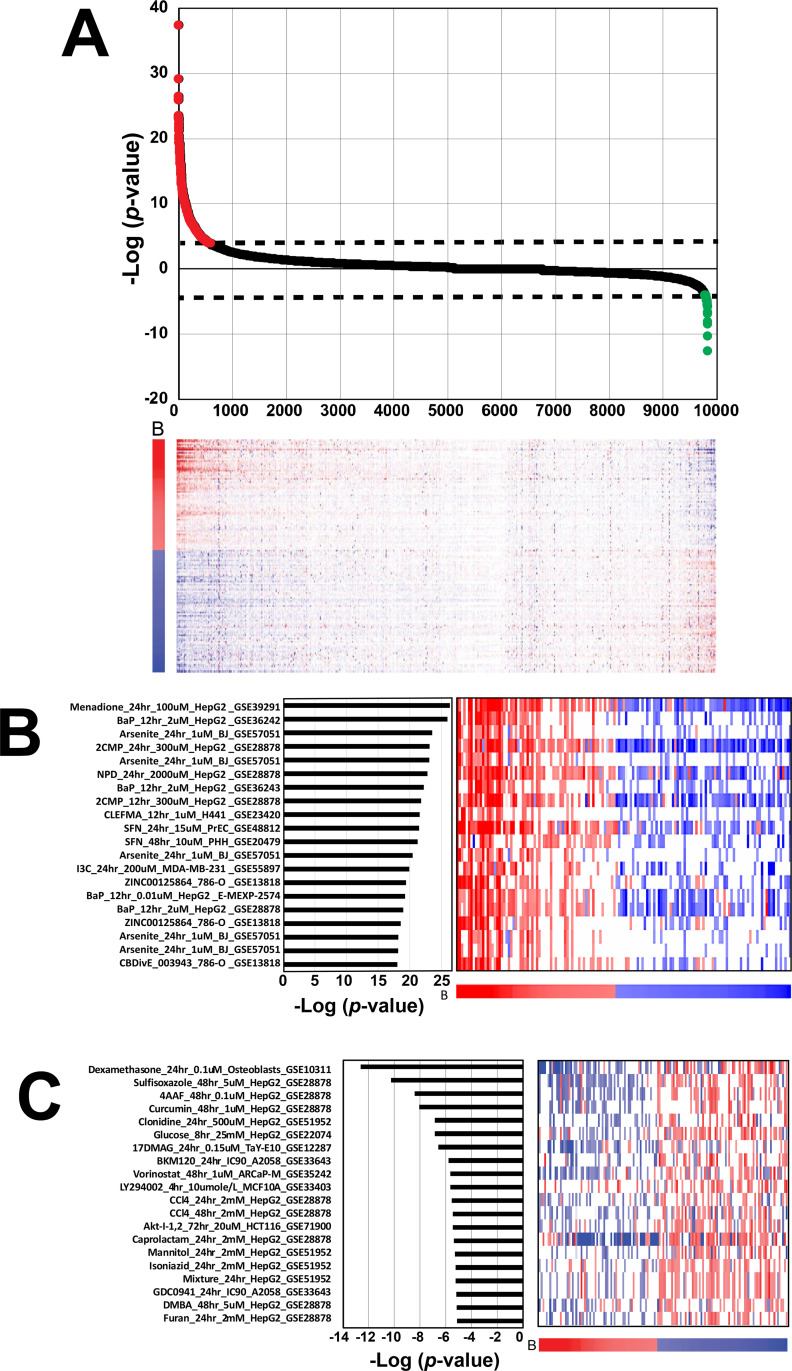
Fig 4. NRF2 activity across biosets from chemically treated human cells.
A. (Top) Biosets derived from microarray comparisons of human cells exposed to chemicals were rank ordered based on their correlation to the biomarker using the -Log(p-value) of the Running Fisher test. Biosets with positive correlation (red) to the biomarker are on the left and biosets with negative correlation (green) to the biomarker are on the right. The dashed lines denote the cutoff p-value = 10−4. (Bottom) The heat map shows the expression of genes in the biomarker across the biosets. B, biomarker genes. The numbers refer to rank-ordered bioset number. B. Top 20 chemical biosets that activate NRF2. Right, heatmap depicting the gene expression changes for the 143 genes in the NRF2 biomarker in each bioset. The biomarker gene expression changes are represented across the bottom of the heatmap. Each bioset is represented by the chemical, time and concentration of exposure, cell line used, and annotated study. One study did not have all information available (GSE13818). Abbreviations: BaP, benzo[a]pyrene; 2CMP, 2-(Chloromethyl) pyridine hydrochloride; NPD, 4-Nitro-o-phenylenediamine; CLEFMA, 4-[3,5-bis(2-chlorobenzylidene-4-oxo-piperidine-1-yl)-4-oxo-2-butenoic acid]; SFN, sulforafan; I3C, indole-3-carbinol. C. Top 20 chemical biosets that suppress NRF2. Abbreviations: 4AAF, 4-acetylaminofluorene; 17DMAG, 17-(dimethylaminoethylamino) 17-demethoxygeldanamycin; CCl4, carbon tetrachloride; Mixture, a mixture of liver toxicants; DMBA, 7,12‑Dimethylbenz[a]anthracene.

