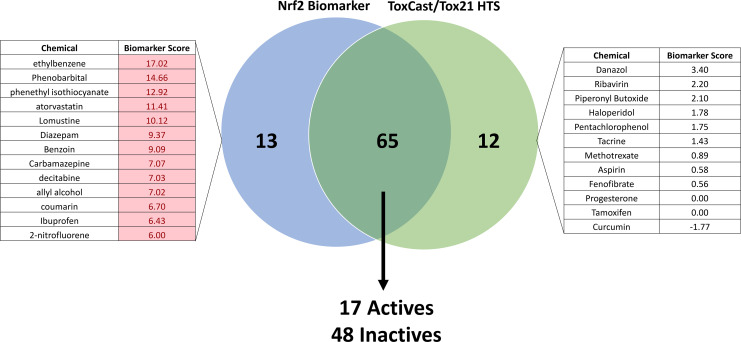
Fig 6. Biomarker prediction agreement with HTS NRF2 assay results.
Maximum biomarker scores for each chemical were extracted from the database of HepG2 and hepatocyte experiments, and activity calls based on these scores were compared with activity determinations from ToxCast and Tox21 NRF2 HTS assays. Chemicals examined at a concentration above the HTS-determined cytotoxicity threshold for that chemical were excluded from the analysis. Lists represent those chemicals classified as NRF2-active by the biomarker only (left) or by HTS only (right). Biomarker score values shaded in red indicate results that are ≥ -Log(p-value) = 4 for activation of NRF2 signaling.

