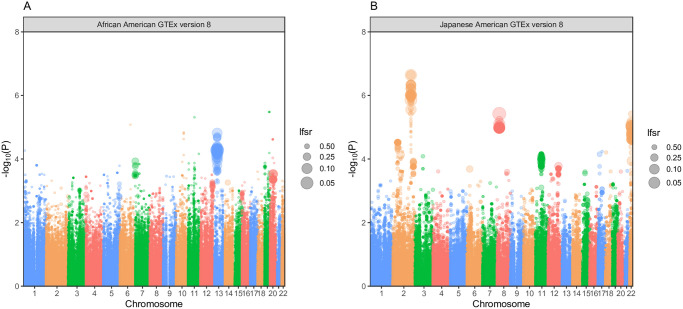
Fig 3. Prostate cancer PrediXcan results for GTEx predicted genes in African American and Japanese American populations.
(A & B) are Manhattan plots of the PrediXcan results using GTEx version 8 mashr gene expression prediction models for the respective African American and Japanese American populations. Each point represents a gene-tissue test for association with prostate cancer via PrediXcan. The y-axis represents the −log10(P) of the gene-tissue test, and the x-axis plots chromosome number. The size of the dot is inversely proportional to its lfsr.

