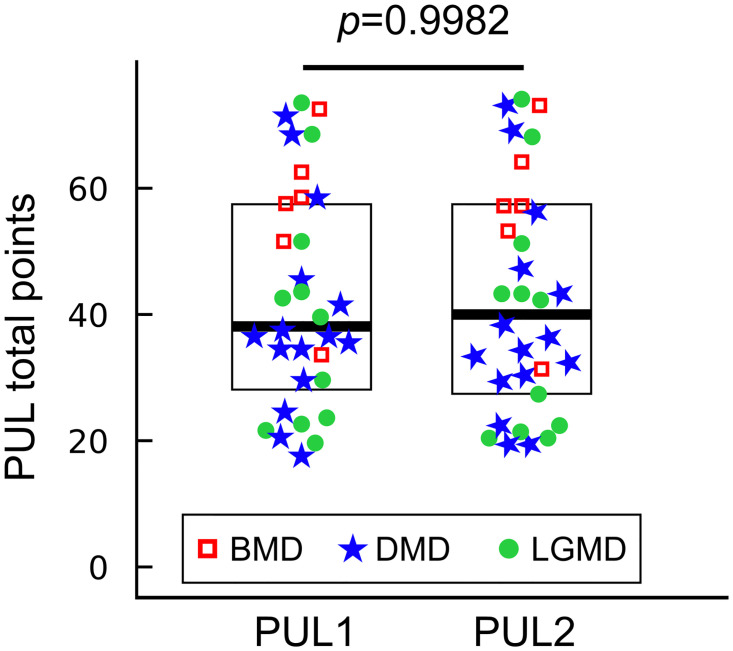
Fig 1. PUL scores as evaluated by two assessors.
Each data point represents one PUL score for the test (PUL1) and the retest (PUL2) for N = 32 patients. Red squares (N = 6), blue stars (N = 15), and green dots (N = 11) are the PUL scores of BMD, DMD, and LGMD patients, respectively. Box-plots show median values of PUL1 and PUL2 (thick lines) and inter-quartile ranges. Paired t-test between PUL1 and PUL2 resulted in a p − value = 0.9982.

