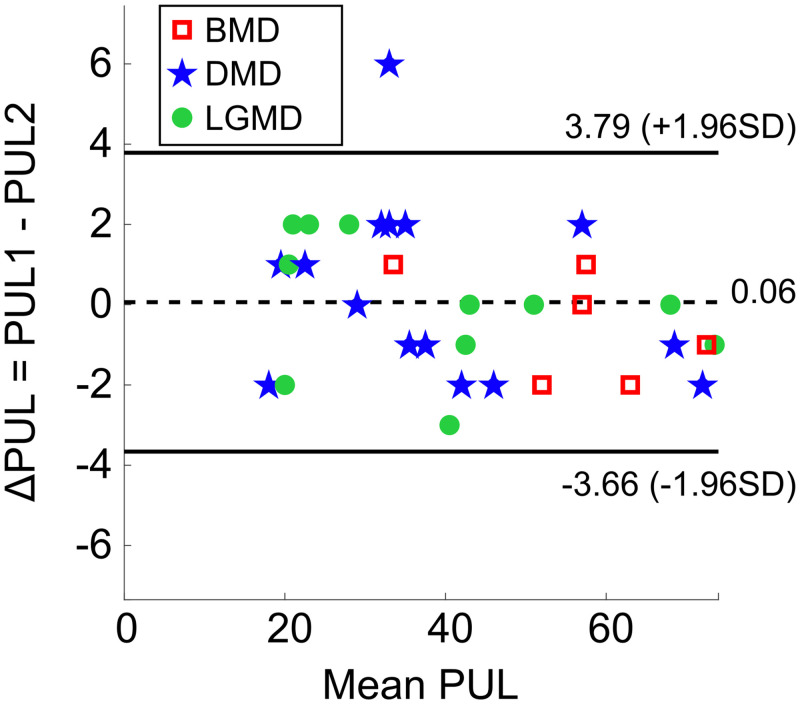
Fig 3. Bland-Altman plot of PUL data obtained by the two assessors.
Each data point represents PUL scores of one patient (N = 32), on the x-axis the mean score () and on the y-axis the difference between test and retest score (ΔPUL = PUL1 − PUL2). Red squares (N = 6), blue stars (N = 15), and green dots (N = 11) are the PUL scores of BMD, DMD, and LGMD patients, respectively. The dashed black line represents the mean difference value (0.06), while the solid black lines represent the 95% limits of agreement for each comparison (mean ± 1.96 SD).

