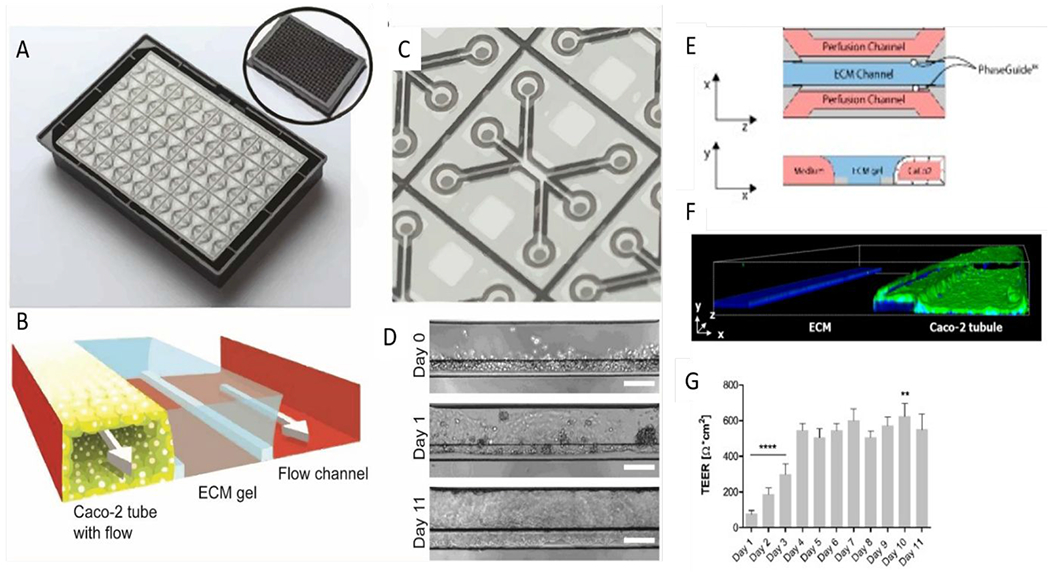
Figure 12.

Studies using the Multiwell OrganoPlate intestinal platform. (A) Image of the bottom of an OrganoPlate showing 40 microfluidic channel networks. Inset shows top view of the 384-well plate device. (B) Zoomed view of a single microfluidic channel network comprising three channels. (C) Schematic of channel network containing cultured gut epithelial tube, ECM gel, and perfusion. (D) Brightfield images of Caco-2 tube formation over 11 days. Scale bars are 100 μm. (E) Transversal view of a microfluidic view; Caco-2 cells adhere to the ECM meniscus created by capillary valves. (F) 3D reconstruction image of a Caco-2 tubule at Day 4 stained for ACTIN (green) and DNA (blue), depicting the nuclei. (G) Transepithelial electrical resistance (TEER) values of Caco-2 tubules over time until Day 11. Data is represented as mean ± SEM. ** p < 0.01; **** p < 0.0001. Comparisons are performed against day 4. Ref. 111 adapted with permission of Springer Nature, copyright 2017. Reproduced from ref. 126 with permission from MDPI, copyright 2019.111, 126
