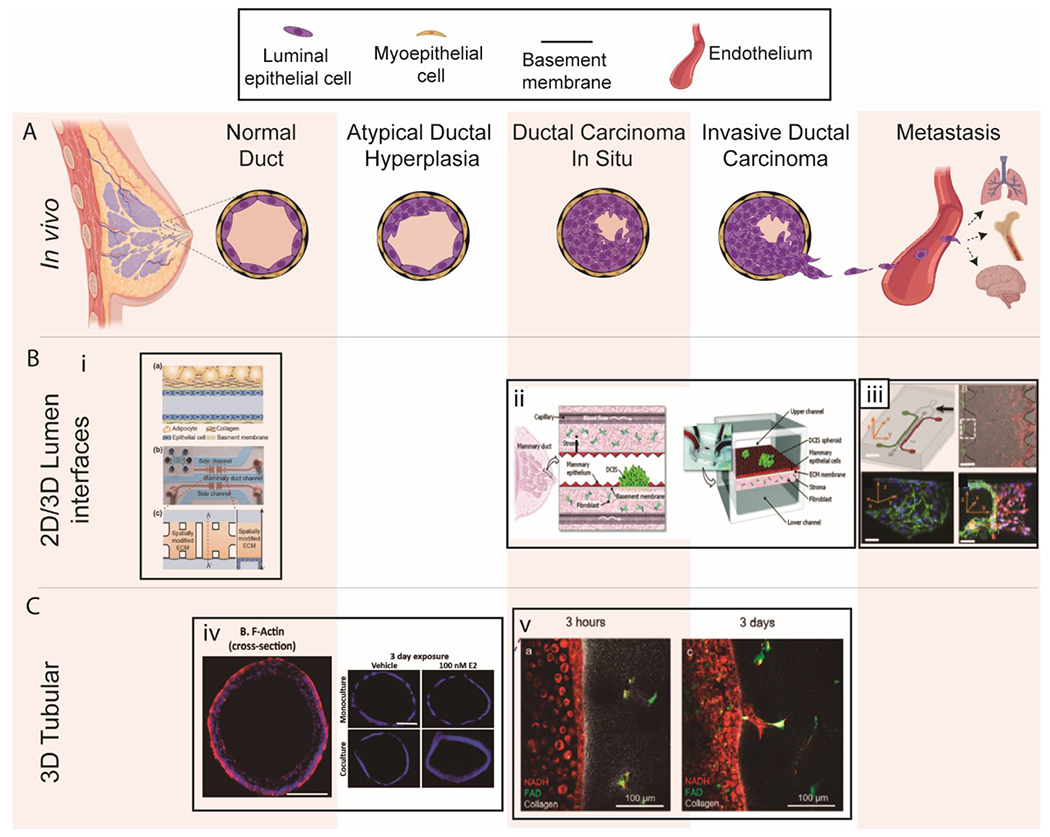
Figure 19.

Overview of breast lumen models. (A) Schematic of breast cancer progression and metastasis. (B) 2D/3D lumen interface models. (i) a. Schematic illustration of a mammary duct b. Photograph of the 3D in vitro mammary duct remodeling model, c. Top and cross-sectional views of the microfluidic device203. (ii) Schematic of DCIS. This model used DCIS spheroids and a fibroblasts stromal layer on opposing sides of an ECM-derived membrane that mimics a basement membrane in vivo202. (iii) Microfluidic tumor-vascular interface model. (Top left) Endothelial channel(green), tumor channel (red), and 3D ECM (dark gray) between the two channels. (Scale bar: 2 mm) (Top right) Phase contrast images showing the fibrosarcoma cells (HT1080, red) invading through the ECM (grey) toward the endothelium (MVEC, green). (Bottom) A single 3D ECM hydrogel matrix region is outlined with the white dashed square. (Scale bar: 300μm). 58 (C) 3D tubular lumen models. (iv)Cross-sectional view of normal MCF7 ducts and hyperplastic lumens after exposure to E2 Scale bars are 100 μm14. (v) Transition from DCIS lumen models to invasive ductal carcinoma models. Copyright (2012) National Academy of Sciences for top-right images, ref 58. Reproduced from ref. 203 with permission from Springer Nature, copyright 2018.
