FIGURE 1:
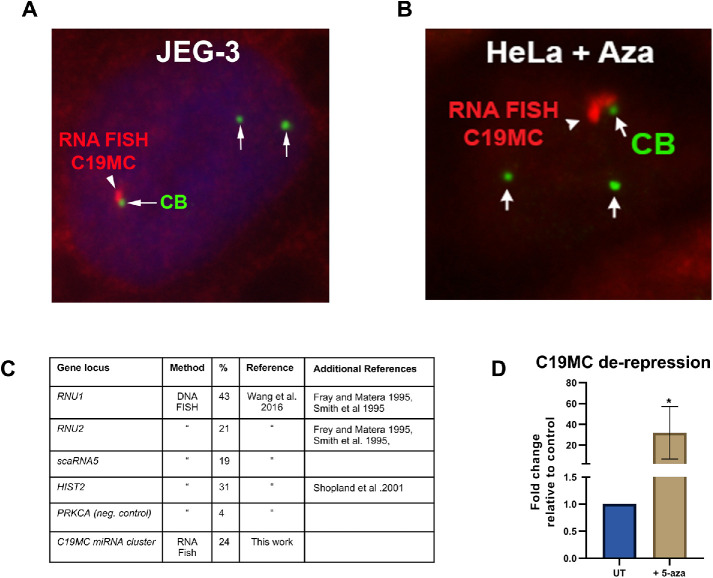
CBs associate with the transcriptionally active C19MC miRNA gene cluster. (A) RNA FISH and IF were used to detect the C19MC primary-miRNA transcript (red) and CBs (green, anti-SMN) in JEG-3 cells. (B) De-repression of the C19MC locus in HeLa cells by 5-aza). RNA FISH and IF were used to detect the C19MC primary-miRNA transcript (red) and CBs (green, anti-coilin). (C) Table of CB association frequency with selected gene loci (Frey and Matera, 1995; Smith et al., 1995; Shopland et al., 2001; Wang et al., 2016). (D) Histogram of C19MC de-repression in HeLa cells treated with 2.5 μM 5-aza for 72 h detected by qRT-PCR: n = 6 biological repeats; *p < 0.05, error bar represents SD. The C19MC primary transcript was amplified using primers that bind exons. GAPDH was used as the normalizer and data is shown with untreated set to 1.

