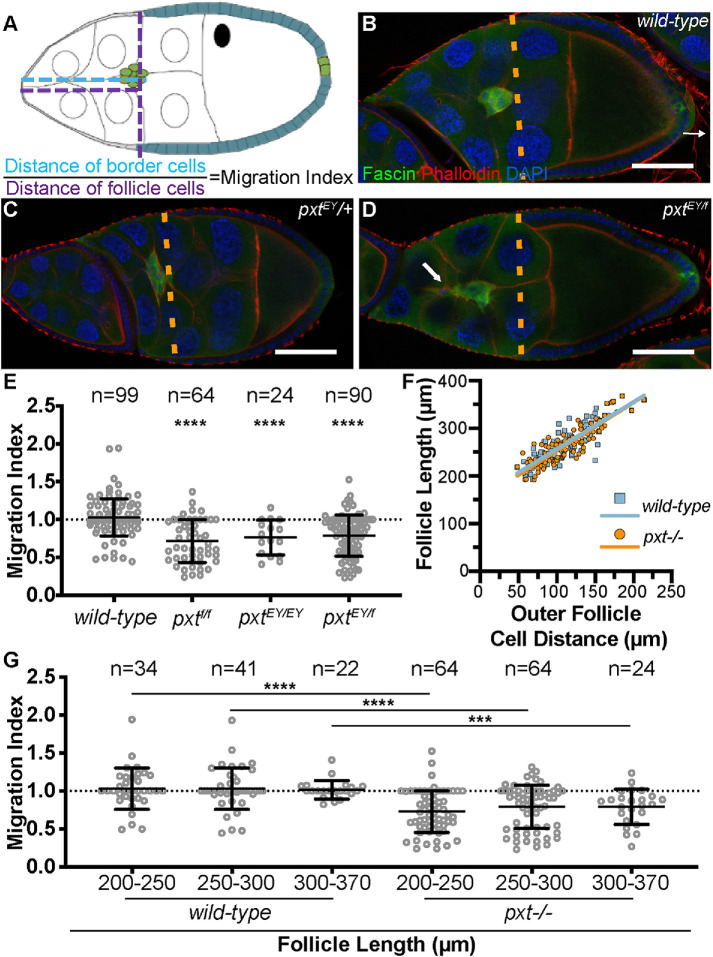
FIGURE 2:
Prostaglandins are essential for on-time border cell migration during S9. (A) Diagram depicting the wild-type alignment of the position of the border cell cluster (green) with that of the outer follicle cells (teal) and the measurements used to quantify border cell migration. The position of the border cells is quantified by measuring the distance from the anterior tip of the follicle to the leading edge of the border cell cluster (A, cyan dashed line), and the position of the outer follicle cells is quantified by measuring from the anterior tip of the follicle to the anterior edge of the outer follicle cells (A, purple dashed line). The migration index is defined as the border cell distance (A, cyan) divided by the outer follicle cell distance (A, purple). Normal or on-time migration should result in a migration index of 1, while delayed migration will result in values <1 and accelerated migration will result in values >1. (B–D) Maximum projections of three confocal slices of S9 follicles of the indicated genotypes; anterior is to the left. (B) wild type (yw). (C) pxtEY/+. (D) pxtEY/f. Merged images: Fascin, green; phalloidin (F-actin), red; and DAPI (DNA), blue. Orange dashed lines indicate the position of the outer follicle cells. White arrow indicates the tail on the border cell cluster. (E, G) Graphs of the migration index quantification during S9 for the indicated genotypes. In G, follicles are binned into groups based on overall follicle length. Each circle represents a single border cell cluster; n = number of follicles. Each line indicates the average and the whiskers indicate the SD (SD). Dotted line at 1 indicates an on-time migration. ****, p < 0.0001; ***, p < 0.001 (two-tailed unpaired t test). (F) Graph of the follicle length vs outer follicle cell distance for wild-type (blue) and pxtEY/f (orange) follicles; each circle represents a single follicle, n = 99 for both genotypes, and the best-fit lines provided. Loss of Pxt results in significant migration delays (D, E). The follicle cell distance vs. follicle length is similar between wild-type and pxt mutant follicles, indicating that outer follicle cell morphogenesis is normal in pxt mutants and therefore, the migration index can be used to assess border cell migration defects during S9. Significant migration delays are observed throughout S9 in pxt mutant follicles (G). Scale bars = 50 μm.

