FIGURE 4:

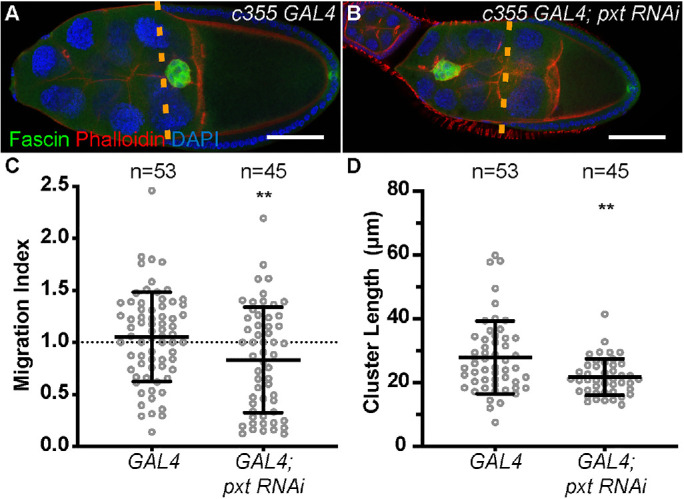
Pxt is required in the somatic cells for on-time border cell migration. (A, B) Maximum projection of three confocal slices of S9 follicles of the indicated genotypes; anterior is to the left. (A) Somatic GAL4 control (c355 GAL4/+). (B) Somatic knockdown of Pxt (c355 GAL4/+; pxt RNAi/+). Merged images: Fascin, green; phalloidin (F-actin), red; and DAPI (DNA), blue. Dashed orange lines indicate the position of the outer follicle cells. (C) Graph of the migration index quantification during S9 for the above indicated genotypes. Dotted line at 1 indicates an on-time migration. (D) Graph of the quantification of primary cluster length for the above indicated genotypes; measured as described in Figure 3. In C and D, each circle represents a single border cell cluster; n = number of follicles. Each line indicates the average and the whiskers indicate the SD. **, p < 0.01 (two-tailed unpaired t test). Somatic knockdown of Pxt (Vienna 14379) results in delayed border cell migration (B, C) and shorter cluster length (D), compared with somatic GAL4 controls (A, C, D). Scale bars = 50 μm.
