FIGURE 5:

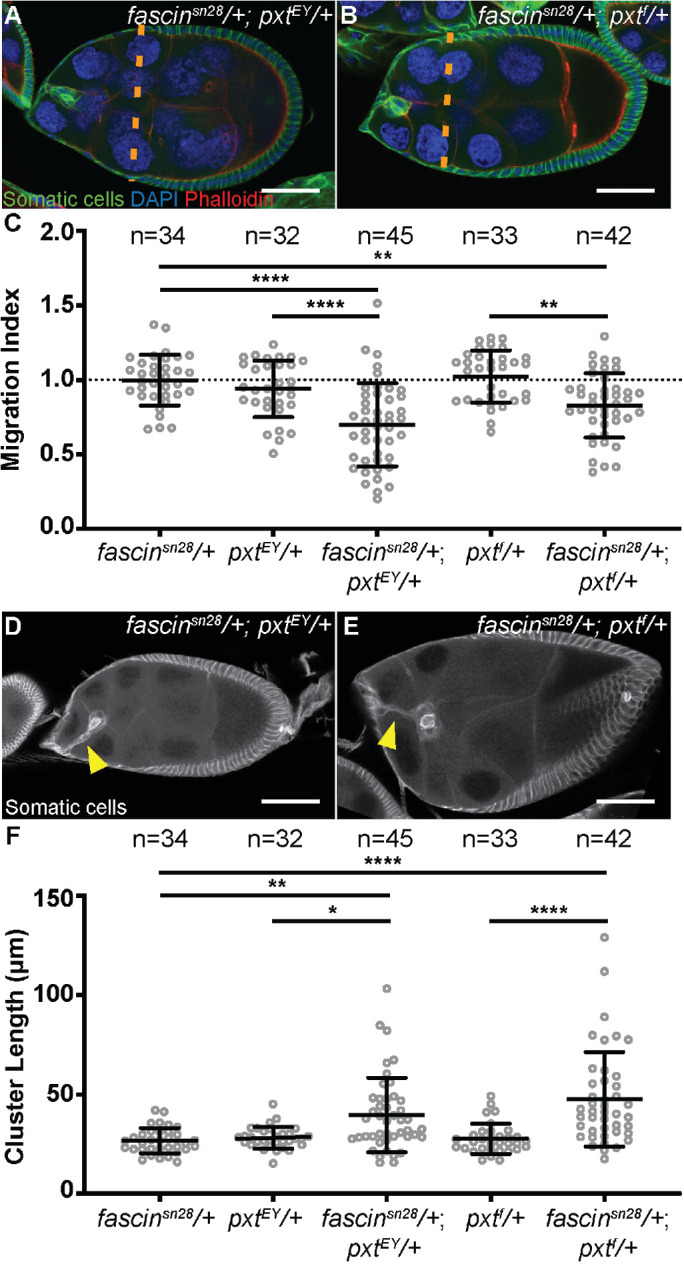
Prostaglandins regulate Fascin to promote border cell migration and control cluster morphology. (A, B) Maximum projections of two to four confocal slices of S9 follicles of the indicated genotypes; anterior is to the left. (A) fascinsn28/+; pxtEY/+. (B) fascinsn28/+; pxtf/+. Merged images: somatic cell stain (Hts and FasIII), green; DAPI (DNA), blue; and phalloidin (F-actin), red. Orange dashed lines indicate the position of the outer follicle cells. (C) Graph of the migration index quantification during S9 for the indicated genotypes. Dotted line at 1 indicates an on-time migration. Each circle represents a single border cell cluster; n = number of follicles. Each line indicates the average and the whiskers indicate the SD. ****, p < 0.0001; **, p < 0.01 (one-way ANOVA with Tukey’s multiple comparison test). (D, E) Maximum projections of two to four confocal slices of S9 follicles of the indicated genotypes stained with the somatic cell stain (Hts and FasIII, white). (D) fascinsn28/+; pxtEY/+. (E) fascinsn28/+; pxtf/+. Yellow arrowheads denote tails attached to the cluster. (F) Graph of the quantification of border cluster length from follicles of the indicated genotypes. Each circle represents a single border cell cluster; n = number of follicles. Each line indicates the average and the whiskers indicate the SD. ****, p < 0.0001; **, p < 0.01; and *, p < 0.05 (one-way ANOVA with Tukey’s multiple comparison test). While heterozygosity for mutations in pxt or fascin do not affect border cell migration or cluster morphology, double heterozygotes (fascin−/+; pxt−/+) exhibit delayed border cell migration (A–C) and elongated clusters (D–F). Scale bars = 50 μm.
