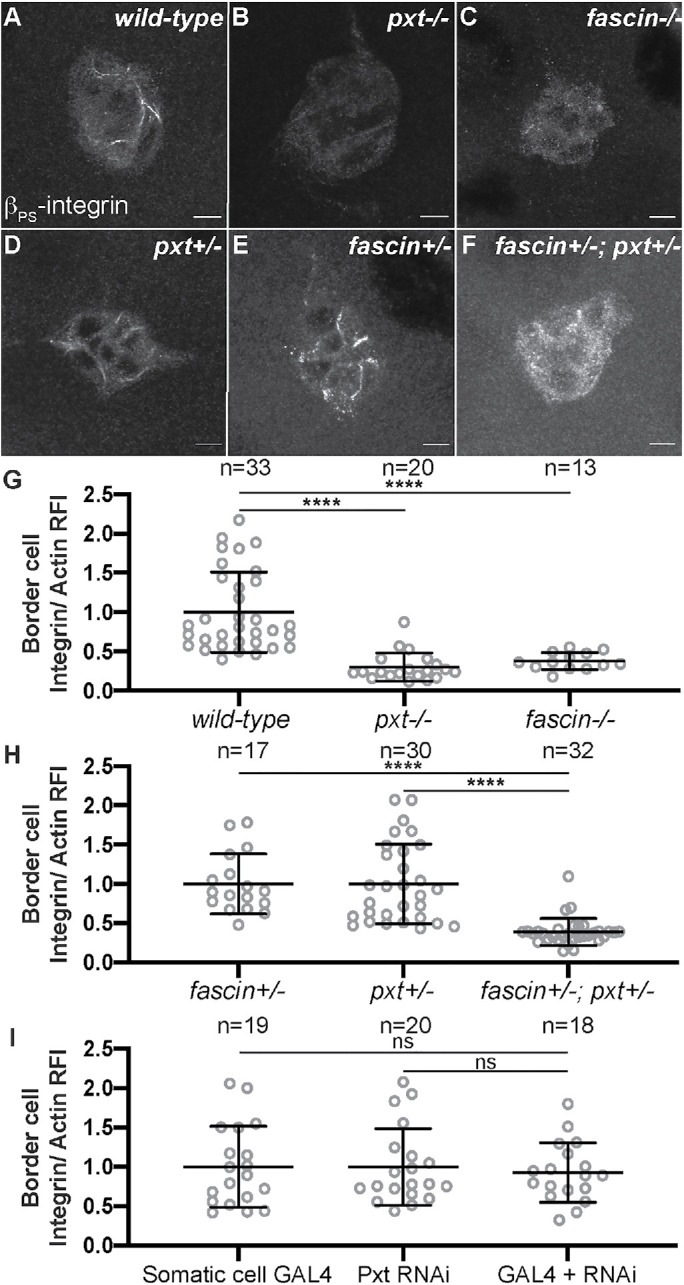
FIGURE 6:

Prostaglandins and Fascin regulate integrin localization on the border cell cluster. (A-F) Maximum projection of three confocal slices of S9 border cell clusters of the indicated genotypes stained with βPS-integrin (white). (A) wild type (yw). (B) pxt−/− (pxtf/f). (C) fascin−/− (fascinsn28/sn28). (D) pxt+/− (pxtf/+). (E) fascin+/− (fascinsn28/+). (F) fascin+/−; pxt+/− (fascinsn28/+; pxtf/+). (G–I) Graphs of the quantification of βPS-integrin intensity along the border cell membranes of the indicated genotypes. Peak βPS-integrin intensity was quantified and normalized to phalloidin staining, three measurements were taken per cluster and averaged, and then normalized to the appropriate control. In G, pxt and fascin mutants were normalized to wild-type controls. In H, fascin+/−; pxt+/− mutants were normalized to the pxt+/− controls. In I, somatic Pxt RNAi knockdown (c355 GAL4/+; pxt RNAi/+) was normalized to the RNAi-only control (pxt RNAi/+). Each circle represents a single border cell cluster; n = number of follicles. Each line indicates the average and the whiskers indicate the SD. ****, p < 0.0001; ns indicates p > 0.05. (one-way ANOVA with Tukey’s multiple comparison test). pxt and fascin mutants show reduced βPS-integrin membrane localization compared with wild-type clusters (A–C, G). Pxt and Fascin genetically interact to regulate βPS-integrin membrane localization (D–F, H). Somatic Pxt knockdown does not alter βPS-integrin membrane localization (I). Scale bars = 10 μm.
