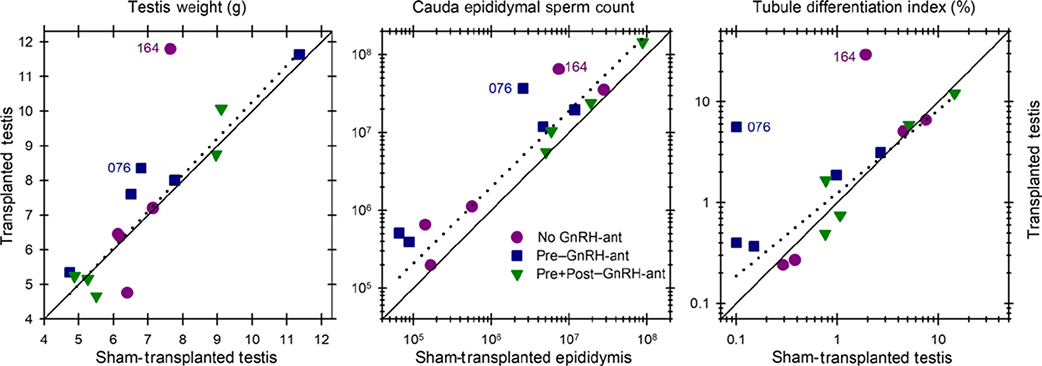
FIGURE 4.
The correlations of spermatogenic endpoints between the transplanted and sham-transplanted testes. The correlations are shown for (A) testes weights, (B) cauda epididymal sperm count, and (C) tubule differentiation indices. The diagonal continuous line represents equivalent response on the two sides. The correlations calculated on the 13 monkeys that did not show appreciable numbers of donor spermatozoa are shown by the dashed lines. Note that these 13 animals without appreciable levels of donor-derived spermatogenesis show a trend toward higher values in the transplanted side than in the sham-transplanted side. Only the differences between the transplanted vs sham-transplanted sides based on the sperm count data from the 13 monkeys were significant (P = .002, Wilcoxon test)

