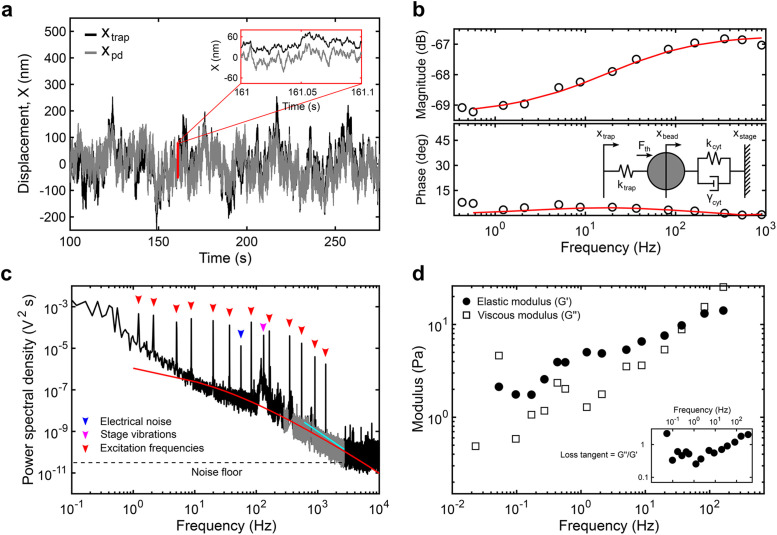
FIGURE 2:
Analytical methods to obtain the viscoelastic properties of the cytoplasm from optical trapping data. (a) Sample trace of the trap position (xtrap, black) and photodiode position (xpd, gray) in the time domain. Note that the photodiode signal is acquired in volts and converted to nanometers after in situ calibration. (b) The magnitude and phase of the response of the photodiode output signal to movements of the trap at each input frequency is captured by the transfer function. The transfer function above 1 Hz is fitted (red) to the active part of a simple viscoelastic model (inset) to obtain the trap stiffness ktrap (pN/nm) and photodiode constant βpd (nm/V). The mechanical circuit (inset) depicts the forces experienced by the bead from the OT and the viscoelastic environment. (c) The power spectrum of the output between 250 and 2500 Hz (gray) resulting from thermal fluctuations is simultaneously fitted (red) to the passive part of the model. Below 250 Hz, nonequilibrium active cellular processes, electrical noise (blue arrowhead), and stage vibrations (magenta arrowhead) contribute to the response while above ∼2500 Hz, the noise floor (dashed line) is reached. The active response from the multifrequency excitation (red arrowheads) is visible. A slope smaller than 2 (cyan) indicates constrained diffusion. (d) The elastic (G’, solid circles) and viscous (G’’, open squares) moduli are obtained for each experiment (see the Supplemental Information).

