FIGURE 1:
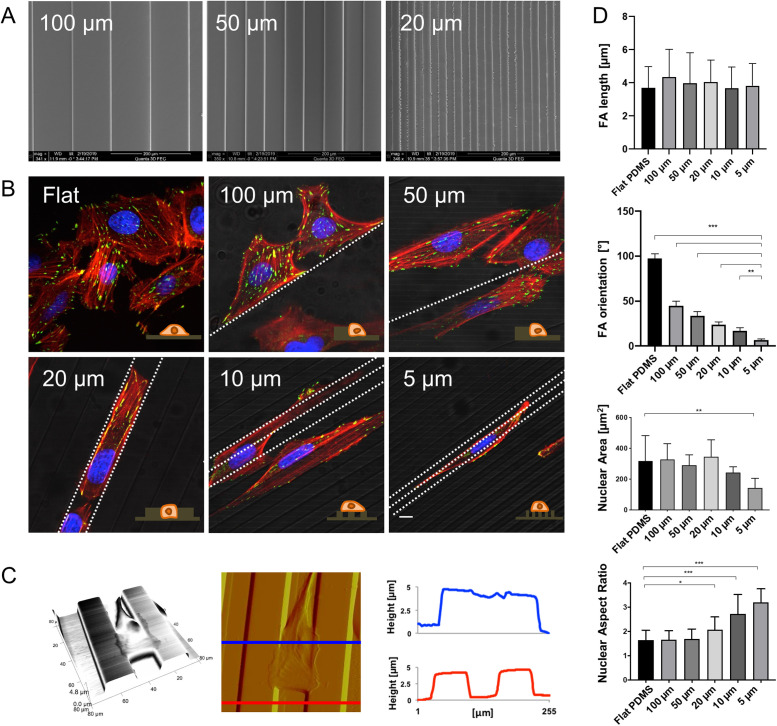
U2OS cell morphology varies strongly with PDMS channel width, achieving cell confinement within 20-µm spaced channels. (A) Scanning electron microscopy (SEM) images of linear PDMS channels with widths of 20 µm, 50 µm, and 100 µm, and lateral wall heights of ∼5 µm. (B) Confocal immunofluorescence images of U2OS cells on flat surfaces and in 5–100-µm-wide channels showing actin (red), vinculin (green), and nuclei (blue). The fluorescence images are superimposed on grayscale phase contrast images to show the underlying substrate; white dotted lines indicate the pattern direction. Scale bar is 10 µm. (C) Left to right, AFM 3D projection, deflection image, and cross-sectional profiles of U2OS cell confined within 20-µm-spaced PDMS channels. As displayed in the deflection image, the cross-section images are measured on the top of the cell (blue) and on bare channels (red). (D) Quantification of FA length and orientation (top two plots) and nuclear area and aspect ratio (bottom two plots) on flat PDMS and channels of 5–100 µm width. All error bars depict standard deviations (n = 10 across three independent experiments; ***, p < 0.0001; **, p < 0.001; *, p < 0.01, as calculated by the Mann-Whitney test between each pair of categories).

