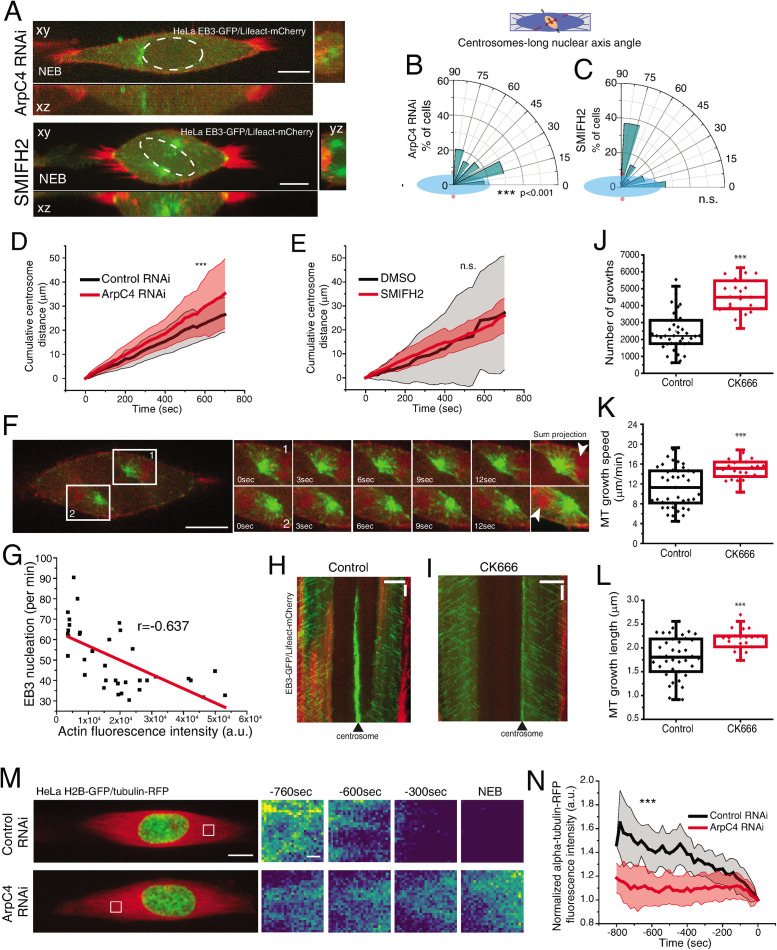
FIGURE 6:
Arp2/3 activity regulates centrosome movement. (A) Representative images of HeLa cells expressing EB3-GFP/Lifeact-mCherry after treatment with ArpC4 RNAi or SMIFH2 at NEB. Scale bar, 10 μm. (B) Polar plots quantifying centrosome positioning (red circles) relative to the longest nuclear axis (blue ellipse) at NEB for cells treated with ArpC4 RNAi (B) or SMIFH2 (C). Cumulative centrosome distance measured for cells treated with ArpC4 RNAi (D) or SMIFH2 (E). (F) HeLa cell expressing EB3-GFP/Lifeact-mCherry filmed with a 500-ms time lapse to show how the presence of actin limits microtubule growth. Scale bar, 10 μm. Time is in seconds. (G) Correlation between actin fluorescence intensity (a.u.) and EB3 nucleation (per minute). Kymograph of cells expressing EB3-GFP/Lifeact-mCherry for control (H) or CK666-treated (I) cells. Horizontal scale bar, 10 μm; vertical scale bar, 30 s. Microtubule dynamics parameters for control (79,899 tracks; 41 cells) and CK666-treated cells (79,957 tracks; 23 cells; ***p < 0.001) indicating number of growths (J), growth speed (K; μm/min), and growth length (L; μm).(M) Representative images of HeLa cells expressing H2B-GFP/tubulin-RFP filmed during mitotic entry. Scale bar, 10 μm. White box corresponds to area used for insets on the right. Insets represent tubulin fluorescence intensity visualized with a Viridis LUT. Scale bar, 1 μm. (N) Quantification of normalized tubulin-RFP fluorescence intensity for controls and ArpC4 RNAi-treated cells (***p < 0.001).

