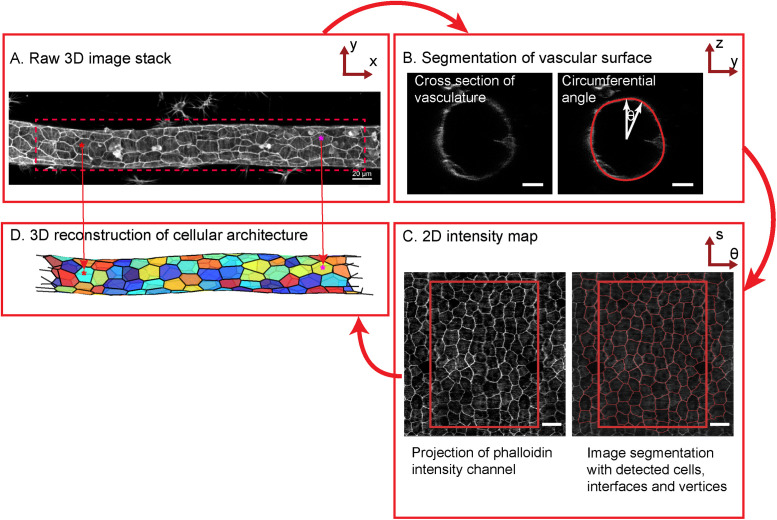
FIGURE 2:
Overview of image analysis workflow. (A) Mean projection of the raw 3-D image stack along the z-axis. (Scale bar = 20 µm.) (B) Raw resized axial section of the vessel with the detected surface overlaid in red. (Scale bar = 10 µm.) (C) Left panel: 2-D projection of the vessel obtained by unwrapping the intensities along each axial section. Right panel: Intensity projection with cell outlines detected by watershed segmentation overlaid in red. Rectangular boxes correspond to nonrepeat regions. (Scale bar = 10 µm.) (D) 3-D reconstruction of the blood vessel with each cell represented by a different color.

