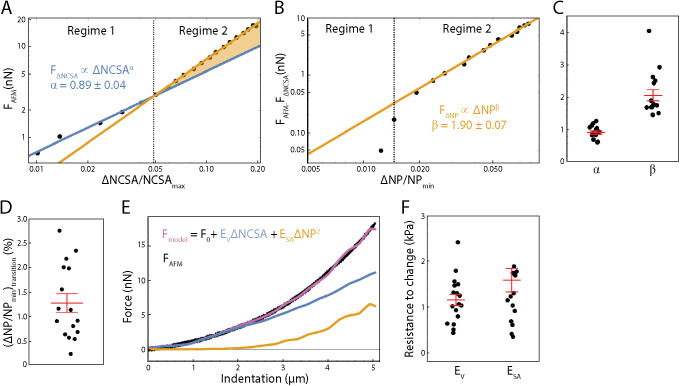
FIGURE 2:
Correlating nuclear morphology and applied force informs an emperical model for strain-stiffening response. (A) Force as recorded by the AFM vs. change in NCSA plotted on a log-log scale. Two distinct power-law regimes are observed. (B) Force as recorded by the AFM minus the force response in regime 1 plotted against change in NP on a log-log scale, showing a single power-law relationship in regime 2. (C) α, the exponent for  , and β, the exponent for
  , as determined for n = 16 cells. Red bars represent mean and SEM. (D) The strain in NP at the transition point between regime 1 and regime 2 as determined for n = 16 cells. Red bars represent mean and SEM. (E) An emperical model for nuclear deformation as shown over force vs. indentation. We display our full emperical model (magenta), the individual contributions required to deform the nuclear volume and surface area (blue and orange, respectively), and the AFM data over the full indentaiton. (F) Resistance to nuclear volume change,
  , and resistance to nuclear surface area change,
  , as determined for n = 17 cells. Red bars represent mean and SEM.

