FIGURE 4:
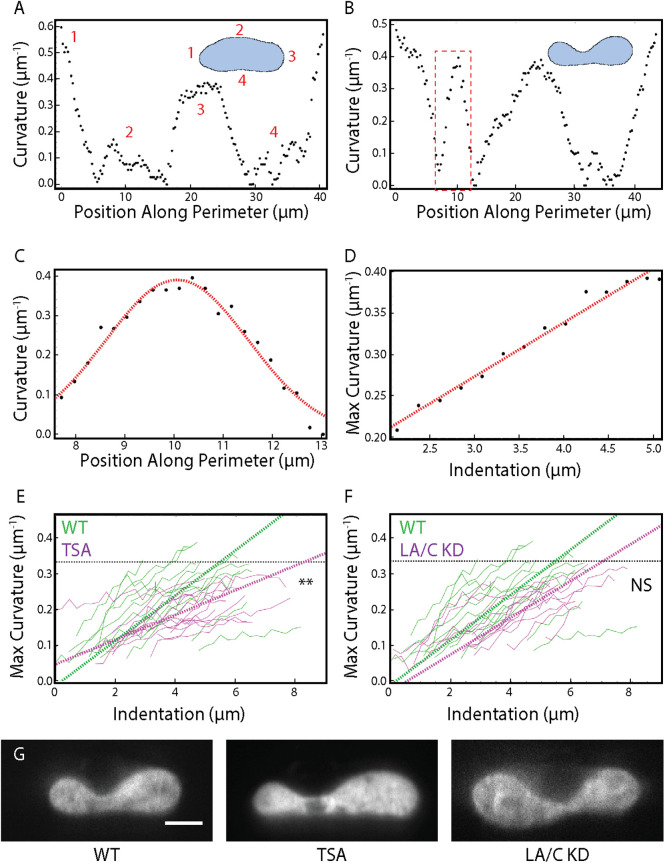
Dynamic nuclear curvature analysis during AFM indentation. (A) Nuclear curvature vs. position along perimeter for an undeformed nucleus. The inset displays the mask of the nucleus and the discretization of the perimeter. (B) Nuclear curvature vs. position along the perimeter for a deformed nucleus. The inset displays the mask of the nucleus and the discretization of the perimeter. Note the additional peak centered around 10 µm representing the site of indentation. (C) A Gaussian fit to the peak at the site of indentation extracts maximum curvature under the AFM bead (red dashed box in B). (D) Maximum curvature plotted during the entire indentation. A linear fit is performed for the region of changing curvature. (E) Maximum curvature as a function of indentation plotted for n = 14 WT cells and n = 14 TSA-treated cells. ** represnts p < 0.01 for a t test comparing the mean slope of maximum curvature vs. indentation. (F) Maximum curvature as a function of indentation plotted for n = 14 WT cells and n = 13 LA/C KD cells. Black dashed line represents curvature of the AFM bead. NS represents no significance for a t test comparing the mean slope of maximum curvature vs. indentation. (G) Representative images of SKOV3 nuclei (H2B) under maximum compression with various treatments. Scale bar = 5 µm.

